
Cincinnati Financial Corporation 2016 Annual Shareholder Meeting Notice

1. Electing 15 directors for one-year terms; 2. Amending the company’s Amended Articles of Incorporation to add majority voting standards for uncontested director elections; 3. Ratifying the selection of Deloitte & Touche LLP as the company’s independent registered public accounting firm for 2016; 4. Approving the Cincinnati Financial Corporation Stock Compensation Plan of 2016; 5. Voting on a nonbinding proposal to approve compensation for the company’s named executive officers; and 6. Transacting such other business as may properly come before the meeting.
| 1. | Electing 14 directors for one-year terms; |
| 2. | Ratifying the selection of Deloitte & Touche LLP as the company’s independent registered public accounting firm for 2017; |
| 3. | Voting on a nonbinding proposal to approve compensation for the company’s named executive officers; |
| 4. | Voting on a nonbinding proposal to establish the frequency of future nonbinding votes on executive compensation; and |
| 5. | Transacting such other business as may properly come before the meeting. |
Page 1
Page 2
officers, or on the proposal to establish the frequency of future nonbinding votes on executive compensation. Name and Address of Beneficial Owner March 7, 2017. 2016: May 6, 2017. 34. 39. 30. to be mass-directed to board members of a number of companies; or correspondence that raises issues related to specific company transactions (insurance policies or claims) where there may be privacy concerns or other issues. $131,470. $548,622. $657,569. selling the company’s insurance products to the agency’s clients. This agency does not advise the company on our insurance needs or sell insurance products or services to the company. The audit committee has selected the firm of Deloitte & Touche LLP as the company’s independent registered public accounting firm for 2017. 2016. Certified Public Accountants (AICPA) agreed-upon procedures, security and privacy control-related assessments, technology control assessments, technology quality assurance, financial reporting control assessments, enterprise security architecture assessment, tax controversy advice. The board of directors recommends a vote FOR the resolution approving the compensation of our named executive officers as disclosed in this proxy statement. Martin F. Hollenbeck that as an associate’s level of responsibility increases, so should the proportion of performance-based compensation. As a result, our executive compensation program aims to tie a meaningful level of each officer’s compensation to awards that require achievement of the primary financial objectives by which we measure the company’s performance, creating a firm link between pay and performance. 2016. payments under this plan when circumstances warrant. Awards of incentive compensation tie vesting of a portion of annual cash compensation to performance goals and can qualify as performance-based, tax-deductible executive compensation. 2016. and exercisable. If performance hurdles are achieved and an award of PSUs vests, the award is paid in shares of common stock, one share for each restricted stock unit. For PSUs, the Committee expects to set targets that it considers achievable, but that require some stretch, based on market conditions and the current insurance industry environment at the time of grant. Name 67. 69. 2016. company or to consider potential prospective changes to the structure of the executive compensation program. discretion to reduce or eliminate payment of awards) to qualify for the performance-based compensation exception to the $1 million limitation. In addition, stock options are considered performance-based compensation that can qualify for the exception. given that compensation the Committee intends to satisfy the requirements for exemption from Section 162(m) in fact will. 2014 617,769 - - 238,082 293,810 65,887 63,426 403,650 - - 95,751 69,042 1,421,139 1,800,893 2014. Equity Incentive Units or Other Deferral elections are made before the plan year for which compensation is to be deferred and are effective for the entire year. These elections generally may not be modified or terminated for that year. Compensation deferred by the named executive officer is credited to the individual’s deferred compensation account maintained by the company. 2016. 22, 201720152016 performance, please review the company’s 20152016 Annual Report on Form 10-K.Date and Time:April 30, 2016, 9:30 a.m. ETPlace:Cincinnati Art Museum, 953 Eden Park Drive, Cincinnati, Ohio 45202Record Date:February 29, 2016Meeting Webcast:cinfin.com/investors Our Board’s
Recommendation13)16)FOR Each Director Nominee Adopt Majority Voting Standard for Uncontested Director Elections (Page 28)FOR30)34)FOR Approve Cincinnati Financial Corporation 2016 Stock Compensation Plan (Page 33)FOR39)37)FOR 1 YEAR 2015,2016, the company continued to follow its strong governance policies and practices to benefit shareholders. Highlights included:·Forbes has again ranked Cincinnati Financial Corporation, operating through The Cincinnati Insurance Companies, among America’s 50 Most Trustworthy Financial Companies in 2015. This marks the fifth consecutive time Forbes has recognized Cincinnati Financial for trustworthiness. ©2015, Forbes Media LLC. Used With Permission.·To reinforce our commitment to accountability and strong corporate governance practices, our board of directors is recommending that shareholders vote to approve an amendment to our Amended Articles of Incorporation to implement a majority voting standard for uncontested director elections.·Cybersecurity is a growing threat for all companies. Accordingly, the audit committee increased its understanding of the company’s cybersecurity risk by engaging third-party experts to test and audit the company’s cybersecurity program structure and capabilities. At the committee’s invitation, the entire board attended the final presentation and received the final report.·Succession planning at all levels is important to the long-term success of the company. In 2015, the board continued its practice of attending meetings of the subsidiary boards during which more than a dozen executives provide reports. These meetings provide the directors with opportunities to become familiar with this level of management, assess their development over time and gain in-depth knowledge about the company’s operating businesses. In 2015, the board also discussed potential management succession candidates with the chief executive officer at one of its regular meetings.Page 313.16. Each director stands for election annually.Name Age Primary Occupation Independent Committee Other Memberships Public Company Boards William F. Bahl* 64 Chairman, Bahl & Gaynor Investment Counsel Inc. √ A, C, E, I, N (Chair) 0 Gregory T. Bier 69 Managing Partner (Retired), Deloitte LLP √ A, C, I 1 Linda W. Clement-Holmes 53 Chief Information Officer, The Procter & Gamble Company √ A, N 0 Dirk J. Debbink 60 Chairman and Chief Executive Officer, MSI General Corporation √ A, C 0 Steven J. Johnston 56 President and Chief Executive Officer, Cincinnati Financial Corporation E (Chair), I 0 Kenneth C. Lichtendahl 67 Director of Development and Sales, Heliosphere Designs LLC √ A, N 0 W. Rodney McMullen 55 Chairman and Chief Executive Officer, The Kroger Co. √ C (Chair), E, I 2 David P. Osborn 55 President, Osborn Rohs Williams & Donohoe LLC √ A, I 0 Gretchen W. Price 61 Executive Vice President, Chief Financial and Administrative Officer, Arbonne International LLC √ A (Chair), C, N 0 John J. Schiff, Jr. 72 Former Chairman and Chief Executive Officer, Cincinnati Financial Corporation I 0 Thomas R. Schiff 68 Chairman and Chief Executive Officer, John J. & Thomas R. Schiff & Co. Inc. I 0 Douglas S. Skidmore 53 Chief Executive Officer, Skidmore Sales & Distributing Company Inc. √ A, N 0 Kenneth W. Stecher 69 Chairman of the Board, Cincinnati Financial Corporation E, I (Chair) 0 John F. Steele, Jr. 62 Chairman and Chief Executive Officer, Hilltop Basic Resources Inc. √ A, E 0 Larry R. Webb 60 President, Webb Insurance Agency Inc. E, I 0 *Lead Independent DirectorAAudit CommitteeCCompensation CommitteeEExecutive CommitteeIInvestment CommitteeNNominating CommitteePage 4Name Age Primary Occupation Independent Committee Memberships Other Public Company Boards William F. Bahl* 65 Chairman, Bahl & Gaynor Investment Counsel Inc. ü A, C, E, I, N (Chair) 0 Gregory T. Bier 70 Managing Partner (Retired), Deloitte LLP ü A, C, I 0 Linda W. Clement-Holmes 54 Chief Information Officer, The Procter & Gamble Company ü A, N 0 Dirk J. Debbink 61 Chairman and Chief Executive Officer, MSI General Corporation ü A, C 0 Steven J. Johnston 57 President and Chief Executive Officer, Cincinnati Financial Corporation E (Chair), I 0 Kenneth C. Lichtendahl 68 Director of Development and Sales, Heliosphere Designs LLC ü A, N 0 W. Rodney McMullen 56 Chairman and Chief Executive Officer, The Kroger Co. ü C (Chair), E, I 2 David P. Osborn 56 President, Osborn Williams & Donohoe LLC ü A, I 0 Gretchen W. Price 62 Executive Vice President, Chief Financial and Administrative Officer, Arbonne International LLC ü A (Chair), C, N 0 Thomas R. Schiff 69 Chairman and Chief Executive Officer, John J. & Thomas R. Schiff & Co. Inc. I 0 Douglas S. Skidmore 54 Chief Executive Officer, Skidmore Sales & Distributing Company Inc. ü A, N 0 Kenneth W. Stecher 70 Chairman of the Board, Cincinnati Financial Corporation E, I (Chair) 0 John F. Steele, Jr. 63 Chairman and Chief Executive Officer, Hilltop Basic Resources Inc. ü A, E 0 Larry R. Webb 61 President, Webb Insurance Agency Inc. E, I 0 20152015,2016, the company delivered strong operating results1 and acceptable short-term financial performance that benefited shareholders with one-year and three-year total shareholder return (TSR) of 31.5 percent and 60.6 percent respectively; a 10 percent increase in book value; and a volatile4.3 percent increase in regular cash dividends, excluding the special cash dividend declared in the fourth quarter of 2015. This strong performance generated payouts of annual incentive compensation at the maximum level and payouts of performance restricted stock units at target levels for our named executive officers. Highlights of our company's strong year included:environment. Highlights included:·A combined ratio of 91.1 percent, the fourth consecutive year of underwriting profit. In 2015, our efforts to further segment our renewal and new business opportunitiesgains better pricing precision and risk-selection decisions continued to improve underwriting performance. More favorable weather in 2015 also benefited underwriting profits.·A 21 percent increase in net income to $634 million.·A 5 percent increase in consolidated property casualty net written premiums, including 1 percent from our new reinsurance assumed operations. The increase in premiums also reflects other growth initiatives, modest average price increases and a higher level of insured exposures.·Less than a 1 percent full-year increase in fair value of invested assets at December 31, 2015, including a 3 percent decrease for the stock portfolio and a 2 percent increase for the bond portfolio.·A 4 percent increase in pretax investment income, net of expenses, reflecting a 9 percent increase in equity portfolio dividends and a 3 percent growth in interest income.·A decrease of less than a dollar in book value at December 31, 2015, to $39.20 per share compared with book value of $40.14 per share at December 31, 2014.·A value creation ratio (VCR) of 3.4 percent, below our announced goal of producing an annual average VCR of 10 percent to 13 percent for the five-year period from 2013 to 2017. A volatile equities market offset the strong operating results and lowered our VCR. Our VCR exceeded the VCR of four of the 10 companies in our peer group.·At December 31, 2015, our one-year total shareholder return of 19.0 percent exceeded that measure for six of the 10 companies in the peer group and our cumulative three-year total shareholder return of 69.07 percent exceeded that measure for four of the 10 companies in our peer group.·A 31 percent increase to $2.30 per share in cash dividends declared, including a special cash dividend of $0.46 per share declared in the fourth quarter of 2015.For our shareholders, these efforts supported an increase of our regular annual cash dividend for the 5556thconsecutive year and payment of a special cash dividend of $0.46 per share in the fourth quarter of 2015.year. Through the cash dividends paid and share repurchases made during the year, we returned $419$345 million to shareholders in 2015,2016, and $1.033$1.063 billion during the three years ended December 31, 2015.Page 5201520152016 compensation for each named executive officer as determined under Securities and Exchange Commission (SEC) rules. See the notes accompanying the Summary Compensation Table (SCT) on Page 5660 for more information.Name and Principal Position Salary Bonus Stock Option Nonequity Change in All Other Total ($) ($) Awards Awards Incentive Pension Value Compensation Compensation ($) ($) Plan and Nonqualified ($) ($) Compen- Deferred sation Compensation ($) Earnings ($) Steven J. Johnston 941,975 - 665,213 151,834 283,662 - 121,300 2,163,984 Chief Executive Officer & President Jacob F. Scherer, Jr. 863,477 - 410,863 90,465 169,015 721,831 13,842 2,269,493 Chief Insurance Officer Michael J. Sewell 769,279 - 365,735 80,599 150,577 - 86,508 1,452,698 Chief Financial Officer Martin F. Hollenbeck 633,539 - 301,914 66,437 124,122 - 71,004 1,197,016 Chief Investment Officer Charles P. Stoneburner II 633,539 - 301,914 66,437 124,122 607,422 9,175 1,742,609 Senior Vice President Name and Principal Position Salary
($)Bonus
($)Stock Awards
($)Option Awards
($)Non-
equity Incentive Plan Compensa-
tion
($)Change in Pension Value and Non-
qualified Deferred Compensa-
tion Earnings
($)All Other Compensa-
tion
($)Total Compensa-
tion
($)Steven J. Johnston 960,814 — 917,696 155,459 2,121,792 — 94,142 4,249,903 Chief Executive Officer
& PresidentJacob F. Scherer, Jr. 887,747 — 581,968 93,542 1,160,572 575,137 19,200 3,318,166 Chief Insurance Officer Michael J. Sewell 784,665 — 513,159 82,525 1,023,925 — 71,520 2,475,794 Chief Financial Officer Martin F. Hollenbeck 646,808 — 423,473 68,033 844,032 — 59,884 2,042,230 Chief Investment Officer Charles P. Stoneburner II 657,090 — 431,722 69,367 860,582 444,699 13,533 2,476,993 Senior Vice President 2015.Page 6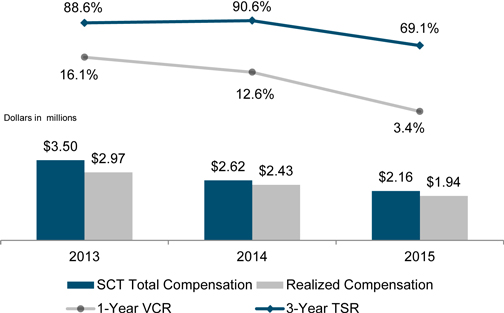
CEO Pay for Performance 2013 2014 2015 SCT Total Compensation $ 3,501,957 $ 2,623,807 $ 2,163,984 Realized Compensation(1) $ 2,971,137 $ 2,434,715 $ 1,936,016 1-Year VCR 16.1% 12.6% 3.4% 3-Year Total Shareholder Return(2) 88.6% 90.6% 69.1% 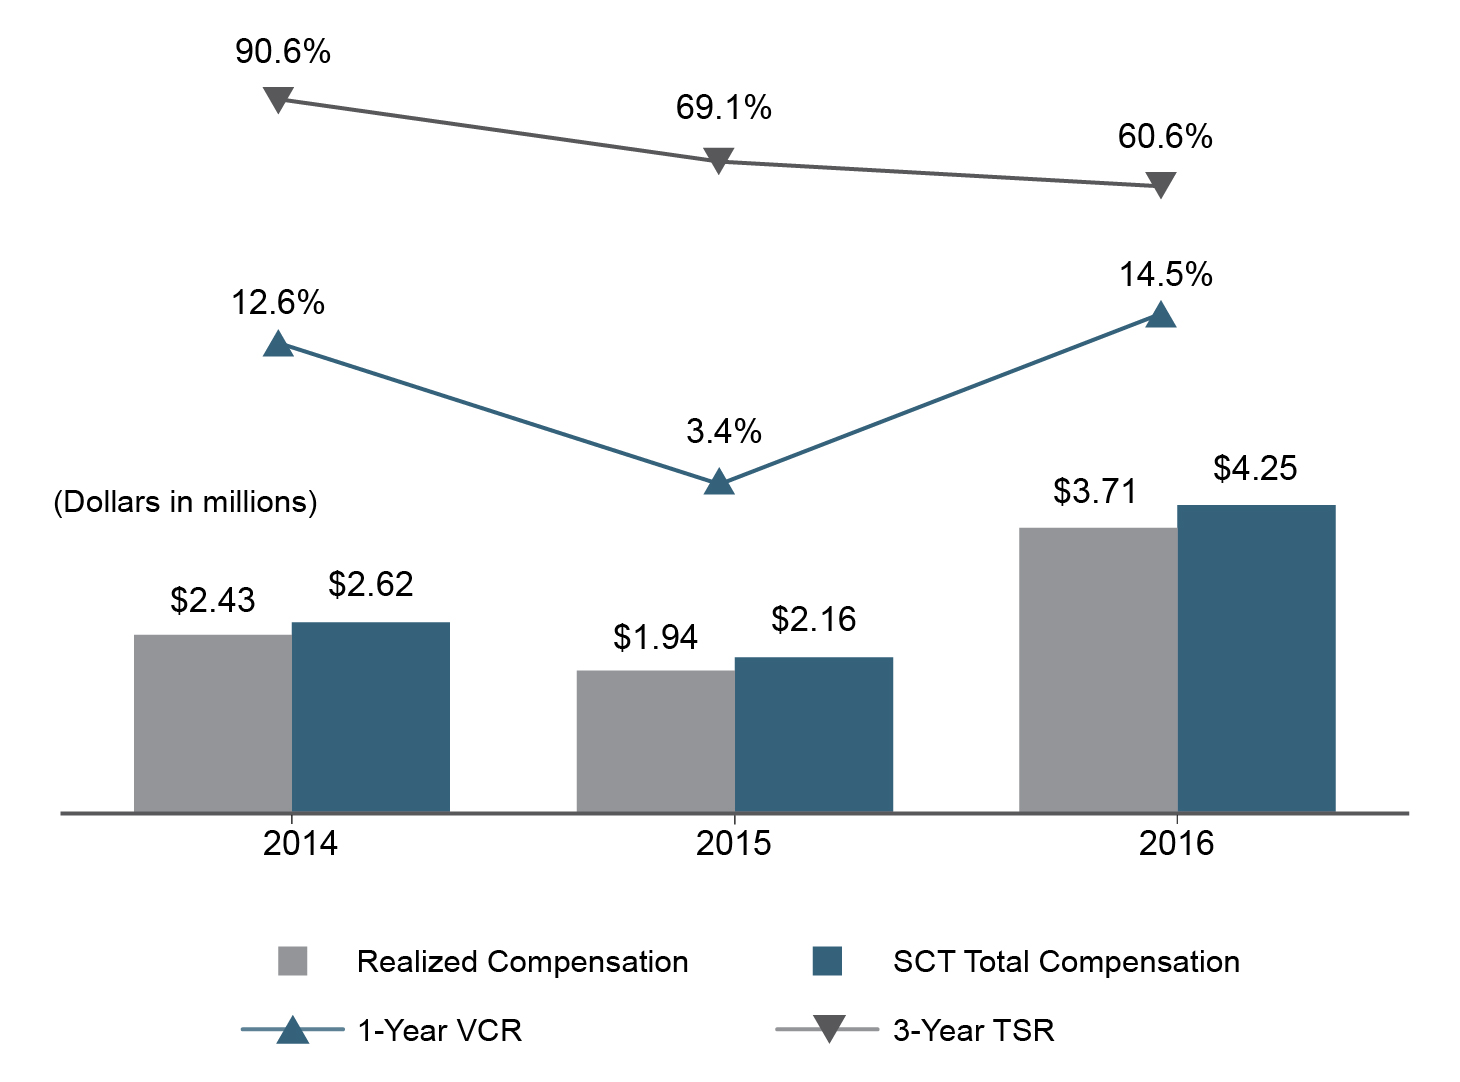
CEO Pay for Performance 2014 2015 2016 SCT Total Compensation $ 2,623,807 $ 2,163,984 $ 4,249,903 $ 2,434,715 $ 1,936,016 $ 3,711,998 1-Year VCR 12.6 % 3.4 % 14.5 % 90.6 % 69.1 % 60.6 % (1) Realized compensation is the sum of salary and annual incentive cash compensation reported in the Summary Compensation TableSCT for the year plus the value realized from the exercise of stock options and vesting of time-vesting or performance-based restricted stock units, if any, reported in the Option Exercises and Stock Vested table for the year.(2) 3-Year Total Shareholder ReturnTSR is total shareholder return for the 3-year performance period ending December 31 of a given year, as calculated by and displayed on Bloomberg LP.20172018 Annual Meeting of Shareholders·Shareholder proposals submitted for inclusion in our 2017 proxy statement pursuant to SEC Rule 14a-8 must be received by us by November 18, 2016.·Notice of shareholder proposals to be raised from the floor of the 2017 Annual Meeting of Shareholders outside of SEC Rule 14a-8 must be received by us between January 21, 2017, and March 1, 2017.20172018 Annual Meeting of Shareholders begins on Page 66.75.Page 7Why are these materials important?20162017 Annual Meeting of Shareholders. Shareholders of record at the close of business on February 29, 2016,March 7, 2017, may vote. You have one vote for each share of common stock you owned on that date. There were 164,353,605 outstanding164,815,425 shares of common stock outstanding as of the close of business on February 29, 2016.March 7, 2017. A majority of the outstanding shares, or 82,176,80482,407,714 shares, must be represented to hold the meeting. This constitutes a quorum.How do I vote?20152016 financial materials and proxy statement online and for voting via the Internet,internet, by telephone or by mail, along with the required Control Number (the Control Number is unique to each account). The Notice also includes instructions on how to request paper materials.20152016 Annual Report on Form 10-K, the Annual Letter From the Chairman and the Chief Executive Officer and the 20162017 Shareholder Meeting Notice and Proxy Statement as requested in late March or early April.·
By telephone or over the Internet.telephone. You may vote your shares by calling 1-888-693-86831-866-804-9616.
viaproxy card that you received in the Internet atVoteFast.com/cinf no later than 11:59 p.m. ETmail.
By scanning the QR code on April 29, 2016. Ifyour proxy card or Notice with your mobile device. The QR code on your proxy card or Notice is a unique identifier so you vote by telephone or via the Internet, you dowill not need to returnenter a Control Number. If you scan the QR code with your mobile device, you will access our proxy card bymaterials along with a voting screen.
By mail. Voting by telephone or on the Internet is convenient, reduces the use of natural resources and saves significant postage and processing costs. Your vote is also recorded immediately and there is no risk that postal delays could cause your vote to arrive late and therefore not be counted.·By Mail. If you received printed proxy materials, you may submit your vote by completing, signing and dating each proxy card received and returning it in the prepaid envelope. Sign your name exactly as it appears on the proxy card. Be sure to return your proxy card in time to be received and counted before the Annual Meeting.
·In person at the Annual Meeting.Meeting. You may vote your shares in person at the Annual Meeting. Even if you plan to attend the Annual Meeting in person, we recommend that you also submit your proxy card or voting instructions, vote by telephone or via the Internetinternet by the applicable deadline so that your vote will be counted if you later decide not to attend the meeting.Internetinternet voting will depend on the voting process of your broker or nominee. Shares held beneficially may be voted in person at the Annual Meeting only if you obtain a legal proxy from your broker or nominee giving you the right to vote the shares.How do I locate my Control Number?Page 8Can I obtain another proxy card so I can vote by mail?Can my shares be voted if I don’t return my proxy or voting instructions and don’t attend the annual meeting?amend the company’s Amended Articles of Incorporation to add majority voting standards for uncontested director elections, to approve the Cincinnati Financial Corporation Stock Compensation Plan of 2016, or to approve compensation for our named executive officers.Can I change my vote or revoke my proxy?Internetinternet or telephone or send in a new signed proxy card with a later date. If you are a Shareholder of Record, you may send a written notice of revocation to the corporate secretary of the company. If you hold shares directly in your name and attend the annual meeting, you also may choose to vote in person. At the meeting, you can request a ballot and direct that your previously submitted proxy not be used.How are the votes counted?Could other matters be decided at the meeting?Can I listen to the meeting if I cannot attend in person?How can I obtain a 2015 Annual Report?20152016 Annual Report on Form 10-K as filed with the SEC at no cost in several ways. You may view, search or print the document online fromcinfin.com/investors orviewproxy.com/cinfin/20162017. You may ask that a copy be mailed to you by contacting the corporate secretary of Cincinnati Financial Corporation. Or, you may request it directly from Shareholder Services. Please see the Investor Contacts page ofcinfin.com/investors for details. These contacts are also listed at the end of this proxy statement.Page 9February 29, 2016.Title
of ClassAmount and Nature of
Beneficial OwnershipFootnote
ReferencePercent
of Class Common stock The Vanguard Group Inc. 13,085,145 (1) 7.98 100 Vanguard Blvd. Malvern, PA 19355 Common stock BlackRock Inc. 12,190,350 (2) 7.40 40 East 52nd Street New York, NY 10022 Common stock John J. Schiff, Jr., CPCU* 11,482,209 (3)(4)(5)(6)(7) 6.99 Cincinnati Financial Corporation 6200 South Gilmore Road Fairfield, OH 45014 Common stock State Street Corporation 10,375,229 (8) 6.30 State Street Financial Center One Lincoln Street Boston, MA 02111 Common stock Thomas R. Schiff* 9,425,967 (3)(4)(7)(10) 5.74 Cincinnati Financial Corporation 6200 South Gilmore Road Fairfield, OH 45014 Fairfield, OH 45014 Common stock First Eagle Investment Management LLC 8,528,358 (9) 5.20 1345 Avenue of the Americas New York, NY 10105 Title
of ClassName and Address of Beneficial Owner Amount and Nature of Beneficial Ownership Footnote Reference Percent of Class Common Stock The Vanguard Group Inc. 15,805,265 (1) 9.59 100 Vanguard Blvd. Malvern, PA 19355 Common Stock BlackRock Inc. 12,888,090 (2) 7.82 40 East 52nd Street New York, NY 10022 Common Stock John J. Schiff, Jr., CPCU* 11,419,620 (3)(4)(5)(6)(7) 6.93 Cincinnati Financial Corporation 6200 South Gilmore Road Fairfield, Ohio 45014 Common Stock State Street Corporation 9,739,956 (8) 5.91 State Street Financial Center One Lincoln Street Boston, MA 02111 Common Stock Thomas R. Schiff* 9,422,576 (3)(4)(7)(9) 5.72 Cincinnati Financial Corporation 6200 South Gilmore Road Fairfield, Ohio 45014 Page 10February 29, 2016,March 7, 2017, are shown below: Name of Beneficial Owner Amount and Nature of
Beneficial OwnershipFootnote
ReferencePercent
of Class Other Directors and Named Executive Officers William F. Bahl, CFA, CIC 227,712 (11) 0.14 Gregory T. Bier, CPA (ret.) 23,312 0.01 Linda W. Clement-Holmes 8,256 0.01 Dirk J. Debbink 23,545 0.01 Martin F. Hollenbeck, CFA, CPCU 68,292 (5)(6)(7) 0.04 Steven J. Johnston, FCAS, MAAA, CFA, CERA 193,950 (5)(6) 0.12 Kenneth C. Lichtendahl 34,130 0.02 W. Rodney McMullen 48,647 0.03 David P. Osborn, CFA 30,952 0.02 Gretchen W. Price 25,085 0.02 Jacob F. Scherer, Jr. 171,096 (5)(7) 0.10 Michael J. Sewell, CPA 78,926 (5)(6) 0.05 Douglas S. Skidmore 34,593 (12) 0.02 Kenneth W. Stecher 217,750 (5)(7) 0.13 John F. Steele, Jr. 21,920 0.01 Charles P. Stoneburner II, AIM, CPCU 79,125 (5)(7) 0.05 Larry R. Webb, CPCU 497,827 (13) 0.30 All directors and nondirector executive officers as a group (28 individuals) 15,145,290 (3)(4)(5)(6)(7)(10)(11)(12)(13) 9.22 Name of Beneficial Owner Amount and Nature of Beneficial Ownership Footnote
ReferencePercent
of Class Other Directors and
Named Executive Officers William F. Bahl, CFA, CIC 229,122 (10) 0.14 Gregory T. Bier, CPA (ret.) 24,722 0.01 Linda W. Clement-Holmes 9,307 0.01 Dirk J. Debbink 25,801 0.02 Martin F. Hollenbeck,
CFA, CPCU76,915 (5)(6)(7) 0.05 Steven J. Johnston,
FCAS, MAAA, CFA, CERA239,071 (5)(6) 0.15 Kenneth C. Lichtendahl 35,181 0.02 W. Rodney McMullen 50,057 0.03 David P. Osborn, CFA 33,512 0.02 Gretchen W. Price 26,241 0.02 Jacob F. Scherer, Jr. 184,722 (5)(7) 0.11 Michael J. Sewell, CPA 92,510 (5)(6) 0.06 Douglas S. Skidmore 35,623 (11) 0.02 Kenneth W. Stecher 191,550 (5)(7) 0.12 John F. Steele, Jr. 23,161 0.01 Charles P. Stoneburner II,
CPCU, AIM**89,446 (5)(7) 0.05 Larry R. Webb, CPCU 499,237 (12) 0.30 All directors and nondirector executive officers as a group
(28 individuals)15,248,811 (3)(4)(5)(6)(7)
(9)(10)(11)(12)9.25 (1) Reflects ownership as of December 31, 2015,2016, according to Form 13G/A filed by The Vanguard Group Inc. on February 10, 2016.9, 2017.(2) Reflects ownership as of December 31, 2015,2016, according to Form 13G/A filed by BlackRock Inc. on January 21, 2016.19, 2017.(3) Includes 6,562,9866,735,249 shares owned of record by the Mary R. Schiff and John J. Schiff Foundation and 735,532563,269 shares owned of record by the John J. Schiff Charitable Lead Trust. The trustees of both are Messrs. J. Schiff, Jr., T. Schiff and Ms. S. Reid, who share voting and investment power equally.(4) Includes 107,186 shares owned of record by the John J. & Thomas R. Schiff & Co. Inc. pension plan, the trustees of which are Messrs. J. Schiff, Jr. and T. Schiff, who share voting and investment power; and 124,249 shares owned by John J. & Thomas R. Schiff & Co. Inc. for which Messrs. J. Schiff, Jr. and T. Schiff share voting and investment power. (5) Includes shares available within 60 days from exercise of stock options in the amount of 57,60662,785 shares for Mr. Johnston; 44,30845,453 for Mr. Scherer; 120,38371,502 shares for Mr. J. Schiff, Jr.; 27,57225,253 shares for Mr. Sewell; 25,12127,188 shares for Mr. Hollenbeck; 95,37745,304 shares for Mr. Stecher; 31,32035,637 for Mr. Stoneburner; and 97,675100,304 shares for the nondirector executive officers as a group.(6) Includes shares held in the company’s nonqualified savings plan for highly compensated associates in the amounts of 78,20492,212 shares for Mr. Johnston; 4,5954,719 shares for Mr. Hollenbeck; 11,06711,366 shares for Mr. Sewell; 17,60918,084 shares for Mr. J. Schiff, Jr.; and 17,11018,793 shares for the nondirector executive officers as a group. Individuals participating in this plan do not have the right to vote these shares.(7) Includes shares pledged as collateral as of December 31, 2015,2016, in the amounts of 18,218 for Mr. Hollenbeck; 123,891126,683 for Mr. Scherer; 1,363,512 for Mr. J. Schiff, Jr.; 753,233 for Mr. T. Schiff; 30,47551,556 for Mr. Stecher; 15,291 for Mr. Stoneburner and 266,352245,830 for the nondirector executive officers as a group.(8) Reflects ownership as of December 31, 2015,2016, according to Form 13G filed by State Street Corporation on February 12, 2016.6, 2017.(9)Reflects ownership as of December 31, 2015, according to Form 13G/A filed by First Eagle Investment Management LLC on February 4, 2016.(10)(9)Includes 104,218111,468 shares held in Thomas R. Schiff Foundation and 239,540236,540 shares held in TRS Investments LLC., of which Mr. T. Schiff has voting and investment power.(11)(10) Includes 8,821 shares held in the Bahl Family Foundation, of which Mr. Bahl is president. (12)(11) Includes 7,035 shares owned of record by Skidmore Sales Profit Sharing Plan, of which Mr. Skidmore is an administrator and shares investment authority. (13)(12) Includes 186,257 shares owned of record by a limited partnership of which Mr. Webb is a general partner and 43,478 shares owned of record by a marital trust for the benefit of his wife and children. Page 112015.Page 12Proposal 1 – Election of Directors20, 2015,18, 2016, the board, upon the recommendation of its nominating committee, unanimously nominated the 1514 directors listed below for re-election to the board at the 20162017 Annual Meeting of Shareholders. Mr. John J. Schiff, Jr. is not standing for re-election, having attained the age limitation established in the company's Corporate Governance Guidelines. The board intends to reduce the size of the board to 14 directors at its regularly scheduled meeting that immediately follows the 2017 Annual Meeting of Shareholders.20172018 Annual Meeting and until their successors are duly elected and qualified. Unless otherwise instructed, the persons named in the proxy card (the proxy holders) attached to this proxy statement, as filed with the SEC, intend to vote the proxies held by them for the election of the 1514 nominees named below. The board of directors knows of no reason why these nominees should be unable or unwilling to serve, but if that should be the case, proxies received will be voted for the election of such other persons, if any, as the board of directors may designate.The 15 directorsthe highest number ofmore votes cast for their election than against will be elected directors of the company. BrokerAbstentions and broker nonvotes have no effect on the voting for this proposal.John J. Schiff, Jr., Thomas R. Schiff, Douglas S. Skidmore, Kenneth W. Stecher, John F. Steele, Jr. and Larry R. Webb as directors to hold office until the 20172018 Annual Meeting of Shareholders and until their successors are elected and seated.Nominees for Director2530 under Director Nomination Considerations and Process.the nominees for election to the office of directorour current directors along with their ages, the year first elected as a director, their present positions, principal occupations and public company directorships held in the past five or more years. For each nominee,director, we also describe specific individual qualifications and skills of our directors that contribute to the overall effectiveness of our board and its committees.Page 13Nominees for ElectionDirectorsMarch 7, 2017)(Data
February 29, 2016)the compensation committee and a member of the audit and nominating committees. He was a trustee of The Preferred Group of Funds until 2006 and a board member from 2000 to 2006 of The Hennegan Company, a privately owned, Cincinnati-based printing company. Mr. Bahl earned a Master of Business Administration from the University of Michigan after graduating from the University of Florida. He has qualified for the Chartered Financial Analyst designation since 1979 and the Chartered Investment Counselor designation since 1991. His activities have included leadership and service on nonprofit community boards and foundations benefiting parks, schools, a hospital association and youth organizations.

William F. Bahl, CFA, CIC, age 64, has been a director of the company since 1995 and currently is our lead director and chairman of the nominating committee. He is a member of the audit, compensation, executive and investment committees and a director on our insurance subsidiary boards.Mr. Bahl co-founded an independent registered investment advisory firm that performs financial analysis of publicly held securities, advising and managing portfolios for high net worth individuals and institutional clients. His expertise helps support the board’s oversight of our investment operations, which continue to be our main source of profits. His familiarity with public company governance structures and policies beyond our own contributes to full discussion and evaluation of our options.Mr. Bahl is chairman of the board of Cincinnati-based Bahl & Gaynor Investment Counsel Inc. Prior to co-founding Bahl & Gaynor in 1990, he was senior vice president and chief investment officer at Northern Trust Company in Chicago, having previously worked for Fifth Third Bank and Mellon Bank. From 2005 to 2014, Mr. Bahl was a director of publicly traded LCA-Vision Inc., serving as chair of the compensation committee and a member of the audit and nominating committees. He was a trustee of The Preferred Group of Funds until 2006 and a board member from 2000 to 2006 of The Hennegan Company, a privately owned, Cincinnati-based printing company. Mr. Bahl earned a Master of Business Administration from the University of Michigan after graduating from the University of Florida. He has qualified for the Chartered Financial Analyst designation since 1979 and the Chartered Investment Counselor designation since 1991. His activities have included leadership and service on nonprofit community boards and foundations benefiting parks, schools, a hospital association and youth organizations. 
Gregory T. Bier, CPA (Ret.), age 69, has been a director of the company since 2006. He is a member of the audit, compensation and investment committees and a director on our insurance subsidiary boards.As a former lead partner for a respected independent registered public accounting firm, Mr. Bier brings to our board relevant experience with accounting and financial reporting, SEC filings, complex corporate transactions and mergers and acquisitions for public companies, including Fifth Third Bancorp, The Procter & Gamble Company, The Midland Company, Cincinnati Financial Corporation and The E.W. Scripps Company.Mr. Bier was the managing partner of the Cincinnati office of Deloitte LLP, an independent registered public accounting firm, from 1998 to 2002. He retired in 2002 after 23 years as a partner of the firm and 35 years of service, beginning in 1967 when he joined Haskins & Sells, which later became part of Deloitte. In 2008, he became a director of LifePoint Health Inc., a public company with $5 billion of revenues, which is a leading provider of healthcare services in nonurban communities in 21 states. He chairs LifePoint’s audit and compliance committees and is a member of its compensation, corporate governance and nominating, and quality committees. From 2002 to 2007, Mr. Bier was an audit committee member for Catholic Healthcare Partners (now Mercy Health), one of the largest not-for-profit health systems in the United States. A graduate of Xavier University, he became a CPA in 1970 and is a member with retired status of the American Institute of Certified Public Accountants and the Ohio Society of Certified Public Accountants. His activities have included leadership and service on nonprofit community boards and foundations benefiting several high schools, colleges, social services and civic organizations.Page 14 
Linda W. Clement-Holmes, age 53, has been a director of the company since 2010 and is a member of our audit and nominating committees.Ms. Clement-Holmes ensures full leverage of emerging business technologies to support and speed The Procter & Gamble Company’s innovation and product-supply efforts. Her aptitude and accomplishments in these areas help our board to effectively evaluate our business processes and technology initiatives, supporting alignment of those initiatives with our strategic goals.Ms. Clement-Holmes is chief information officer of publicly traded The Procter & Gamble Company. From 2010 to 2014, she was senior vice president of Global Business Services and also served as chief diversity officer from 2010 to 2012. She was vice president of Global Business Services from 2007 to 2010, with responsibility from 2007 to 2009 for Central and Eastern Europe, Middle East and Africa and, in 2009, for External Strategic Alliances, Flow-to-the-Work Resources & Employee Solutions. From 2006 to 2007, she was manager, Global Business Services, Central and Eastern Europe, Middle East and Africa; and in 2005, manager of Information & Decision Solutions, Infrastructure Services & Governance. Other management positions since 1983 have included service in various business areas: IT Outsourcing Initiative, Global Engineering & Development and Communications, Knowledge & Innovation Center of Expertise, New Initiatives and E-commerce, Sales Management Systems, and Management Systems Operations and Development. Ms. Clement-Holmes holds a Bachelor of Science in industrial management and computer science from Purdue University. Her activities have included leadership and service with academic councils and nonprofit community boards supporting women, families and child care, educational and civic organizations, and professional organizations. 
Dirk J. Debbink,age 60, returned as a director of the company in 2012 after a four-year recall to active duty with the U.S. Navy in Washington, D.C. He previously served as a director from 2004 to 2008. He is a member of the audit and compensation committees.Mr. Debbink has served as a leader, chief executive officer and board member of private companies, nonprofit entities and government organizations ranging from small firms typical of the company’s commercial policyholders to extremely large organizations, including Reserve Deputy Commander of U.S. Pacific Fleet (170,000 sailors) and Commander, Navy Reserve Force (64,000 sailors). While on active duty with the U.S. Navy, he served as a senior member on the staff of the Chief of Naval Operations in the Pentagon. He has extensive experience in strategic planning and execution, sales, marketing, information technology for a worldwide dispersed workforce, human resources, including pension and profit-sharing plans, and government relationships at the federal level. A founder of both private and public nonoperating foundations, he understands the benefits of a long-term perspective toward serving others.Mr. Debbink is chairman since 2007 and chief executive officer since 2012 of MSI General Corporation, a privately owned design/build construction firm. He joined MSI General in 1983, holding various positions of increasing leadership responsibility and serving as the company’s president from 1991 to 2007. From 2008 to 2012, he served in active military duty as Vice Admiral, Chief of Navy Reserve and Commander, Navy Reserve Force. Mr. Debbink joined the board of the United States Naval Institute in 2012 and chairs its finance committee. He is a board member of Fisher House Wisconsin and serves on the fund development and strategic planning committees. In 2014, he became a director of Froedtert Health System and serves on its finance committee. Mr. Debbink earned a Bachelor of Science in systems engineering from the U.S. Naval Academy and a Master of Business Administration from the University of Chicago. He holds professional engineer and real estate broker licenses in the state of Wisconsin and has served the Oconomowoc, Wisconsin area as a member of various community bank, hospital and other nonprofit boards.Page 15 
Steven J. Johnston, FCAS, MAAA, CFA, CERA, age 56, has been a director of the company since 2011. He is chairman of the executive committee, a member of the investment committee and a director on all subsidiary boards.As chief executive officer of Cincinnati Financial Corporation, Mr. Johnston provides the board with information gained from hands-on management of our operations, identifying our near-term and long-term challenges, opportunities and strategies. His management and actuarial expertise and his experience driving technology and efficiency improvements combine with his strong communication skills to aid in his role as liaison between the board and the company management team.Mr. Johnston has been chief executive officer of the company and all subsidiaries, and president of the company and its lead subsidiary, The Cincinnati Insurance Company, since 2011. From 2008 to 2011, he was chief financial officer, senior vice president and secretary for both the company and The Cincinnati Insurance Company, and treasurer of the company. Prior to joining Cincinnati Financial Corporation, Mr. Johnston was chief financial officer of State Auto Insurance Company. He came to the company with more than 25 years of property casualty insurance experience, including a broad background in accounting, finance, actuarial, reinsurance, technology, investments and management of investor and ratings agency relationships. He also served as a director and chairman of the investment committee for State Automobile Mutual Insurance Company. A graduate of Otterbein University, he is a Fellow of the Casualty Actuarial Society, where he served as a member of the audit committee and chairman of the investment and enterprise risk committees. He is a member of the American Academy of Actuaries, a Chartered Financial Analyst and a Chartered Enterprise Risk Analyst. 
Kenneth C. Lichtendahl, age 67, has been a director of the company since 1988 and is a member of our audit and nominating committees.Mr. Lichtendahl’s years of service on our board and audit committee supports institutional continuity with company and industry knowledge accumulated through all phases of industry and economic cycles and through our expansion over that period. He brings valuable insights gained in developing customer relationships, ethical practices, high-quality staff and product differentiation that helped turn his company, Hudepohl-Schoenling Brewing Co., into the 10th largest brewer in the United States before its sale in 1996.Mr. Lichtendahl is the director of development and sales for Heliosphere Designs LLC, a private company marketing solar timepieces. From 2011 to 2012, he served as a senior adviser for Nestle Waters of North America, following Nestle’s acquisition of Sweet Leaf Tea, which had acquired Tradewinds Beverage Company in 2010. From 1996 to 2010, Mr. Lichtendahl was president and a director of Tradewinds, a privately owned, Cincinnati-based company formed following the sale of Hudepohl-Schoenling. He served as president of Hudepohl-Schoenling from 1978 to 1996 and previously held various management positions. He was a director for 12 years of Centennial Savings Bank in Cincinnati, which had grown to 11 offices and $700 million of deposits before its sale to National City Bank in 2000. A graduate of the University of Cincinnati with a Bachelor of Science in industrial management, Mr. Lichtendahl has contributed his leadership and service on nonprofit community boards supporting youth, civic and conservation organizations. 
W. Rodney McMullen, age 55, has been a director of the company since 2001. He is chairman of the compensation committee, a member of the executive and investment committees and a director on our insurance subsidiary boards.Mr. McMullen has worked with The Kroger Co.’s board on business strategy initiatives and transactions, including business model transformation, mergers and acquisitions, divestitures and management transitions. His daily experience leading a large public company equips him to understand and guide management decisions and actions related to planning, risk management, investor relations, marketing and capital management.Mr. McMullen has been chairman of the board of Kroger since January 2015 and chief executive officer since 2014. Kroger is a publicly traded Cincinnati-based company and the world’s third-Page 16largest retailer. He served as Kroger’s president and chief operating officer from 2009 through 2013. Mr. McMullen has been a director of Kroger since 2003, when he was promoted to vice chairman of the board. From 2000 to 2003, he was executive vice president of strategy, planning and finance. He joined Kroger as a part-time store clerk in 1978 and advanced to hold key financial positions, including corporate controller and chief financial officer. In 2016, Mr. McMullen was elected to the board of VF Corporation where he serves on the audit, nominating and governance committees. He is a board member of the Cincinnati Business Committee and Cincinnati Center City Development Corporation (3CDC). From 2007 to 2014, he served on the board of Global Standards 1, a privately owned company that owns UPC and RFID codes, and from 2010 to 2014, he was chairman of GS1 US, a not-for-profit organization that develops supply-chain standards, solution and services for 25 industries. He also was chairman from 2012 to 2014 of 1WorldSync, a nonprofit organization supporting retailers and consumer product manufacturers across the world. Mr. McMullen holds a Master of Science in accounting from the University of Kentucky, where he also completed his Bachelor of Science in accounting and Bachelor of Business Administration in finance. Other activities have included leadership and service on nonprofit community boards and committees that support a private university and independent living for the disabled and disadvantaged. 
David P. Osborn, CFA, age 55, joined the company’s board in November 2013. He is a member of our audit and investment committees and a director on our insurance subsidiary boards.Mr. Osborn draws on more than 30 years of experience as an investment professional to lead his independent investment advisory firm’s dividend growth strategy team. This dividend growth strategy mirrors our own investment strategy, supporting investment committee decisions. His experiences building relationships and setting long-term, strategic business plans enhance board discussions of our company’s long-term outlook and strategic planning activities.Since 2012, Mr. Osborn has been president of Cincinnati-based Osborn Rohs Williams & Donohoe LLC. He joined its predecessor firm in 1993, becoming a partner in 2010. Mr. Osborn previously held positions at PNC Bank from 1987 to 1993 and at Thomson McKinnon Inc. from 1983 to 1987, prior to its acquisition by Prudential Securities. He earned his Bachelor of Science in business administration from Miami University in Oxford, Ohio. Mr. Osborn has qualified for the Chartered Financial Analyst designation since 1991 and is a former president of the CFA Society of Cincinnati. His activities also include leadership and service on the board of a children’s hospital, as well as nonprofit organizations supporting the arts, education, youth services and the care of adults with neurological disorders. 
Gretchen W. Price, age 61, has been a director of the company since 2002. She chairs our audit committee and is a member of our compensation and nominating committees.Ms. Price’s current and past executive positions have developed her expertise in areas of focus for our board, including accounting, auditing and financial reporting, investor relations, capital management, human resources, information technology, strategic planning and business planning. Board discussions and decisions benefit from her knowledge of customer relationship management and distribution chains.Ms. Price is executive vice president, chief financial and administrative officer since 2011 of Arbonne International LLC, a beauty and nutritional product company headquartered in Irvine, California. She leads the firm’s financial, accounting, strategy and business planning, operations, information technology, human resources and international functions. She was executive vice president and chief financial officer from 2008 to 2011 of Philosophy Inc., an international, prestige beauty brand based in Phoenix, Arizona. Prior to 2008, she held positions with increasing responsibility during her 31-year tenure at publicly traded The Procter & Gamble Company, including vice president and general manager from 2006 to 2007 with responsibility for the go-to-market reinvention strategy for Global Operations and the integration of the Gillette acquisition; vice president of finance and accounting for Global Operations from 2001 to 2005, responsible for worldwide financial leadership; vice president and treasurer from 1998 to 2001, responsible for Global Treasury, investor relationsPage 17and mergers and acquisitions; and vice president of Global Internal Audit from 1996 to 1998. Ms. Price served on the board of Beam Inc., a publicly traded, leading global premium spirits company from 2012 to 2015, where she chaired the audit committee and was a member of the compensation committee until it was acquired by Suntory Holdings Ltd. A graduate of the University of Kentucky, she earned the Certified Internal Auditor designation in 1996 and has been a member of the Financial Executives Institute and the Board of Governors of the Institute of Internal Auditors. Her activities have included leadership and service on nonprofit community boards and committees that provide funding for fine arts and music, human service programs and student scholarships. 
John J. Schiff, Jr., CPCU, age 72, has been a director of the company since 1968. He is a member of the investment committee and a director on all subsidiary boards.Mr. Schiff’s long service in our executive and board leadership strongly links us to the mission and values established by our founding agents in 1950. As our former chairman of the board, chief executive officer and a licensed insurance agent, he brings a blended perspective, assuring leadership and cultural continuity through agent-centered decisions that differentiate us from competitors. His insights gained from years of service on multiple public company boards help preserve our business model’s long-term approach to creating shareholder value. He also brings the perspective of a large shareholder to our board discussions and decisions.From 1986 to 2011, Mr. Schiff was chairman of the company’s board of directors and, except from 2006 to 2008, chairman of its lead subsidiary, The Cincinnati Insurance Company. He also was president and chief executive officer of the company and of its lead subsidiary from 1999 to 2006. He retained only the company-level chairman and chief executive officer roles from 2006 to 2008 when he resumed the subsidiary chairman title. From 1983 to 1996, Mr. Schiff was chairman, chief executive officer and an agent with John J. & Thomas R. Schiff & Co. Inc., a privately owned, Cincinnati-based independent insurance agency. Prior to 1983, he was an agent, vice president and secretary of John J. Schiff & Company Inc., which he joined in 1965 after earning a Bachelor of Science in risk and insurance management from The Ohio State University. He earned the Chartered Property Casualty Underwriter designation in 1972 and is a member of The American Institute for Chartered Property Casualty Underwriters, serving as a trustee from 1992 to 2004 and as an executive committee member.Mr. Schiff also has experience as a director of publicly traded Cincinnati-based companies: The Standard Register Company, a document management services company, from 1982 to 2015, with service on its audit and pension advisory committees; Fifth Third Bancorp and The Fifth Third Bank, from 1983 to 2014, with periods of service on the compensation, executive and trust committees; Cinergy Corporation, from 1994 to 2005 when it was acquired by Duke Energy Corporation; and Cinergy’s predecessor, Cincinnati Gas & Electric Company, from 1986 to 1995. He served at various times on Cinergy’s audit and compensation committees. Mr. Schiff also is a director of two privately owned companies, the Cincinnati Bengals Inc. and the independent insurance agency named above. His activities have included leadership and service to nonprofit community boards and foundations that support arts education, high school and university education, a hospital and general philanthropy. 
Thomas R. Schiff, age 68, has been a director of the company since 1975 and is a member of our investment committee. He is a director on our insurance subsidiary boards.Mr. Schiff’s experience on our board helps provide ongoing insight into how we are serving our primary customer, the independent insurance agent. He contributes to board assessments of the impacts of our decisions on agency operations, including sales, claims, professional advising and financial management. Additionally, he brings the perspective of a large shareholder to our board discussions and decisions.Mr. Schiff has been chairman and chief executive officer since 1996 and a director and an agent with John J. & Thomas R. Schiff & Co. Inc., a privately owned, Cincinnati-based independent insurance agency. He was the agency’s president from 1983 to 1996 and sales manager from 1970 to 1983. He also is chief executive officer and chairman of Lightborne Properties andPage 18

Lightborne Communications, privately owned media companies based in the Cincinnati area. Mr. Schiff earned a Bachelor of Business Administration from Ohio University. His activities have included leadership and service to nonprofit community boards and foundations that support fine and performing arts, arts education, a hospital, children’s dental services and general philanthropy. 
Douglas S. Skidmore, age 53, has been a company director since 2004 and is a member of our audit and nominating committees.Mr. Skidmore has been responsible in his executive roles for strategic direction, marketing, human resources and overall growth and performance of his second-generation family business, which shares many characteristics with our typical commercial policyholders. In addition to providing a policyholder view of our products and services, he has management experience that equips him to contribute to the board’s oversight of business processes and technology initiatives.Mr. Skidmore has been chief executive officer since 2003 and director since 1994 of Skidmore Sales & Distributing Company Inc., a privately owned, Cincinnati-based, full-service independent distributor and broker of quality industrial food ingredients. He was president from 1994 to 2013 and marketing manager from 1990 to 1994. Mr. Skidmore was an account marketing representative for IBM Corporation from 1987 to 1990, with early experiences at Intellitech Corporation and at The Procter & Gamble Company’s Food Process and Product Development Lab. He earned a Master of Business Administration in management and operations from the J.L. Kellogg School of Management at Northwestern University after graduating from Purdue University. Mr. Skidmore is a past president of the Food Ingredient Distributors Association and a trustee of the organization since 2005 and also a member of the Institute of Food Technologists since 1990, with experience on its information systems committee. He currently serves on the national board of Athletes in Action, a global nonprofit organization. 
Kenneth W. Stecher, age 69, has been a company director since 2008 and chairman of the board since 2011. He is chairman of the investment committee and a member of the executive committee. He also is the chairman of all subsidiary boards.Mr. Stecher facilitates and guides the business of the board, supporting its effectiveness with his deep knowledge of the company as well as industry challenges and opportunities. Over his long tenure in management, he was our president and chief executive officer responsible for operations, our chief financial officer responsible for capital management, our face to the analyst and investor communities and our corporate secretary conversant in governance issues and trends.From 2008 to 2011, Mr. Stecher was president and chief executive officer of the company and its lead subsidiary, The Cincinnati Insurance Company. For both companies, he was chief financial officer from 2001 to 2008 and executive vice president from 2006 to 2008. He also was chairman of the lead subsidiary from 2006 to 2008. He served as senior vice president for both companies until 2006, beginning in 1999 for the company and in 1997 for its lead subsidiary. He was secretary of both companies from 1999 to 2008, and treasurer of the company from 1999 to 2008. Mr. Stecher advanced through the ranks of the company’s life insurance subsidiaries from 1967 to 1982, when his responsibilities within the accounting area broadened to include property casualty insurance accounting. He is a trustee since 2009 of the American Institute for Chartered Property Casualty Underwriters, and past president of the Insurance Accounting & Systems Association, Southwestern Ohio Chapter. He earned a Master of Business Administration in finance from Xavier University after graduating from the University of Cincinnati with a Bachelor of Science in accounting. His activities have included service and leadership on nonprofit community boards that support high school and college institutions and the United Way of Greater Cincinnati.Page 19 
John F. Steele, Jr., age 62, has been a company director since 2005 and is a member of our audit and executive committees. He is a director on our property casualty insurance subsidiary boards.Mr. Steele has provided his firm with corporate oversight and strategic direction of all aspects of business ownership, operations and customer relationships. He brings to our board a policyholder perspective, including intimate knowledge of family-run corporations and the construction industry, which is the source of 36 percent of our commercial general liability insurance premiums.Mr. Steele is chairman since 2004, chief executive officer since 1994 and a director since 1985 of Hilltop Basic Resources Inc., a privately owned, Cincinnati-based aggregates and ready mixed concrete supplier to the construction industry. He started his career at Hilltop in 1978 in sales and assumed responsibility for operations over time, becoming president in 1991 and holding that title until 2004. Prior to joining Hilltop, he was a sales executive for William Powell Company, a privately owned, industrial valve manufacturer for which he has been a director since 2004. In 2015, Mr. Steele joined the board of advisers of Down-Lite International, a privately held manufacturer of down and feather bedding. He is a member of the board of advisers of Lykins Companies Inc., a privately owned full-service oil company, since 2012. He was a director for privately owned Smook Bros. Inc., a Canadian construction company from 2006 to 2010. He has served on professional boards including the National Stone, Sand & Gravel Association, the Ohio Aggregates Association and the Ohio Ready Mixed Concrete Association. Mr. Steele has a Master of Business Administration from Xavier University and a Bachelor of Arts from Rollins College. His activities have included leadership and service on nonprofit boards for a youth mentoring organization, a university center for the study of family businesses and a community college. 
Larry R. Webb, CPCU, age 60, has been a director of the company since 1979 and is a member of our executive and investment committees. He is a director on our property casualty insurance subsidiary boards.Mr. Webb brings to our board his insights as a principal owner of an independent insurance agency, with duties in financial management and accounting oversight, information technology, human resources, sales and marketing, risk management and relationship development with insurance companies and clients. His long tenure on our board and as a large shareholder, as well as his agency’s representation of our products and services since 1951, brings the board deep institutional knowledge, promoting continuity of the agent-centered mission and values essential to our business model. His agency does not advise the company on our insurance needs or sell insurance products or services to the company.Mr. Webb has been president since 1994 and director since 1980 of Webb Insurance Agency Inc., a privately owned, independent insurance agency based in Lima, Ohio. Prior to becoming president, he was treasurer of the agency from 1981 to 1994. He has been a licensed insurance agent since 1977. He is a director since 2010 of SWD Corporation, a privately owned wholesaler serving small business owners. A graduate of Ohio University, Mr. Webb earned the Chartered Property Casualty Underwriter designation in 1982 and served as president from 1987 to 1988 and director from 1986 to 1992 of the Grand Lake Chapter of CPCU. His activities have included leadership and service to nonprofit community boards that support business ethics, cancer research, an airport authority and cultural organizations.Page 20


2015: Board Audit Compensation Executive Investment Nominating Mr. Bahl X X X X X Chair Mr. Bier X X X X Ms. Clement-Holmes X X X Mr. Debbink X X X Mr. Johnston X Chair X Mr. Lichtendahl X X X Mr. McMullen X Chair X X Mr. Osborn X X X Ms. Price X Chair X X Mr. J. Schiff, Jr. X X Mr. T. Schiff X X Mr. Skidmore X X X Mr. Stecher Chair X Chair Mr. Steele, Jr. X X X Mr. Webb X X X Number of 2015 meetings 4 5 4 5 6 3 Board Audit Compensation Executive Investment Nominating Mr. Bahl X X X X X Chair Mr. Bier X X X X Ms. Clement-Holmes X X X Mr. Debbink X X X Mr. Johnston X Chair X Mr. Lichtendahl X X X Mr. McMullen X Chair X X Mr. Osborn X X X Ms. Price X Chair X X Mr. J. Schiff, Jr. X X Mr. T. Schiff X X Mr. Skidmore X X X Mr. Stecher Chair X Chair Mr. Steele, Jr. X X X Mr. Webb X X X Number of 2016 meetings 5 4 5 5 6 4 2015,2016, all directors attended 100the Annual Meeting of Shareholders and at least 92 percent of the meetings indicated above for the board and committees of which they were members.In May 2015, all of the company’s directors attended the Annual Meeting of Shareholders. The board of directors will review committee assignments at its meeting on April 30, 2016. – - The audit committee oversees the process of accounting and financial reporting, audits and financial statements of the company. The report of the audit committee begins on Page 30. – - The compensation committee discharges the responsibility of the board of directors relating to compensation of the company’s directors, its executive officers and its internal audit officer. The committee also administers the company’s stock-stock compensation and performance-basedannual incentive compensation plans. The report of the compensation committee begins on Page 40.Page 21 – - The executive committee exercises the powers of the board of directors in the management of the business and affairs of the company between meetings of the board of directors. Independence requirements do not apply to the executive committee. – - The investment committee provides oversight of the policies and procedures of the investment department of the company and its subsidiaries and reviews the invested assets of the company. The objective of the committee is to oversee the management of the portfolio to ensure the long-term security of the company. Independence requirements do not apply to the investment committee. – - The nominating committee identifies, recruits and recommends qualified candidates for election as directors and officers of the company and as directors of its subsidiaries. The committee also nominates directors for committee membership. Further, the committee oversees the corporate governance and compliance policies of the company. Information about the director nomination process begins on Page 25.Page 222015,2016, the company continued to follow its strong governance policies and practices to benefit shareholders. Highlights included:·Forbes has again ranked Cincinnati Financial Corporation, operating through The Cincinnati Insurance Companies, among America’s 50 Most Trustworthy Financial Companies in 2015. This marks the fifth consecutive time Forbes has recognized Cincinnati Financial for trustworthiness. ©2015, Forbes Media LLC. Used With Permission.·To reinforce our commitment to accountability and strong corporate governance practices, our board of directors is recommending that shareholders vote to approve an amendment to our Amended Articles of Incorporation to implement a majority voting standard for uncontested director elections.·Cybersecurity is a growing threat for all companies. Accordingly, the audit committee increased its understanding of the company’s cybersecurity risk by engaging third-party experts to test and audit the company’s cybersecurity program structure and capabilities. At the committee’s invitation, the entire board was present to attend the final presentation and receive the final report.·Succession planning at all levels is important to the long term success of the company. In 2015, the board continued its practice of attending meetings of the subsidiary boards during which more than a dozen executives provide reports. These meetings provide the directors with opportunities to become familiar with this level of management, assess their development over time and gain in-depth knowledge about the company’s operating businesses. In 2015, the board also discussed potential management succession candidates with the chief executive officer at one of its regular meetings. – - Our Code of Conduct applies to all of our associates, including our officers and directors. It establishes ethical standards for a variety of topics, including complying with laws and regulations, observing blackout periods for trading in the company’s securities, accepting and giving gifts, handling conflicts of interest, handling the company’s confidential information and personal data of consumers, and reporting illegal or unethical behavior. – - Our audit committee oversees a governance hotline for the reporting of concerns about the company’s auditing, accounting and financial reporting activities. Callers can remain anonymous or identify themselves. The hotline is maintained by a third-party vendor. Transcripts of all calls are reported to the audit committee. – - The chairman of the board presides at all meetings of the board of directors. The chairman is appointed on an annual basis by at least a majority vote of the other directors. Currently, the offices of chairman of the board and chief executive officer are separated. The company has no fixed policy with respect to the separation of the offices of the chairman of the board and chief executive officer. The board believes that the separation of the offices of the chairman of the board and chief executive officer is part of the succession planning process and that it is in the best interests of the company to make this determination from time to time.Page 23 – - Our directors and officers are subject to stock ownership guidelines that set targets for levels of ownership at a multiple of the officer’s salary or director’s meeting fees. As of December 12, 2016, all of our directors and executive officers were in compliance with the guidelines. Director and Officer Ownership Guidelines are available oncinfin.com/investors. – - The board believes that oversight of our risk management efforts is the responsibility of the entire board. It views enterprise risk management as an integral part of our strategic planning process. The subject of risk management is a recurring agenda item for which the board receives a report at each regularly scheduled board meeting from the chief risk officer, including in-person reports twice each year. The chief risk officer has direct access to all members of the board of directors. – - The board annually conducts a self-evaluation. Led by the lead independent director, feedback from individual directors is reviewed and discussed first by the nominating committee and then with the entire board. These discussions include specific governance topics such as director tenure, board refreshment and independencecomposition as well as the diversity of experience, skills, competencies and other qualities of current directors and future director candidates. The board intends for this annual process to help inform its decisions about how to best structure and govern itself in the short- and long-term for the benefit of shareholders. – - Each year, based on all relevant facts and circumstances, the board determines which directors satisfy the criteria for independence. To be found independent, a director must not have a material relationship with the company, either directly or indirectly as a partner (other29, 2016:27, 2017: William F. Bahl, Gregory T. Bier, Linda W. Clement-Holmes, Dirk J. Debbink, Kenneth C. Lichtendahl, W. Rodney McMullen, David P. Osborn, Gretchen W. Price, Douglas S. Skidmore and John F. Steele, Jr. A majority, 10 of our current 15 directors, meet the applicable criteria for independence under Nasdaq listing standards.Page 24 – - The nominating committee considers many factors when determining the eligibility of candidates for nomination as director. The committee does not have a diversity policy; however, the committee’s goal is to nominate candidates from a broad range of experiences and backgrounds who can contribute to the board’s overall effectiveness in meeting its mission. The committee is charged with identifying nominees with certain characteristics:·Demonstrated character and integrity·An ability to work with others·Sufficient time to devote to the affairs of the company·Willingness to enter into a long-term association with the company, in keeping with the company’s overall business strategy20152016 Annual Meeting of Shareholders, no fees were paid to any third party to identify, evaluate or assist in identifying and evaluating potential nominees.Withwith the Board – - Shareholders may direct a communication to board members by sending it to the attention of the corporate secretary of the company, Cincinnati Financial Corporation, P.O. Box 145496, Cincinnati, Ohio, 45250-5496. The company and board of directors have not established a formal process for determining whether all shareholder communication received by the corporate secretary will be forwarded to directors. The board welcomes shareholder communication and has instructed the corporate secretary to use reasonable criteria to determine whether correspondence should be forwarded. The board believes that correspondence has been and will continue to be forwarded appropriately. However, exceptions may occur, and the board does not intend to provide management with instructions that limit its ability to make reasonable business decisions. Examples of exceptions would be routine items such as requests for publicly available information that can be provided by company associates; vendor solicitations that appearPage 25greatermore of our outstanding stock.common shares. The policy covers any related-party transaction that meets the minimum threshold for disclosure in the proxy statement under the relevant SEC rules, generally transactions involving amounts exceeding $120,000 in which a related person has a direct or indirect material interest.·Whether the transaction creates a conflict of interest or would violate the company’s Code of Conduct·Whether the transaction would impair the independence of a director·Whether the transaction would be fair·Any other factor the committee deems appropriate20152016 with related persons were determined to pose no actual conflict of interest and were approved by the committee pursuant to its policy:$5,655,402.$5,393,987. The company purchased various insurance policies through John J. & Thomas R. Schiff & Co. Inc. for premiums totaling $1,019,514.$984,146. John J. & Thomas R. Schiff & Co. Inc. paid rent to the company in the amount of $122,445 for office space located in the headquarters building and purchased property casualty insurance from our insurance subsidiaries for premiums totaling $128,958.$548,755.$658,914.$943,792$1,187,808 as compensation forPage 261718 years of experience with the company. In 2015,2016, the executive officer’s brother-in-law earned compensation consisting of salary, incentive bonus, stock-based compensation and perquisites totaling $132,893.$143,394. The amount of compensation was established by the company in accordance with our employment and compensation practices applicable to associates with equivalent qualifications and responsibilities and holding similar positions.Page 27Proposal 2 – Approval of an Amendment to our Amended Articles of Incorporation to Implement a Majority Voting Standard in Uncontested Director ElectionsUnder this proposal, we are asking our shareholders to adopt an amendment to our Amended Articles of Incorporation (the Articles) to implement a majority voting standard for uncontested director elections. The company’s current voting standard provides forelection of directors pursuant to a plurality vote, which means that the nominees for director receiving the highest number of “for” votes at the company’s annual shareholders’ meeting are elected as directors to fill the number of open positions on the board.In addition to the plurality vote standard, our board has adopted a policy to assure that, in an uncontested election for which cumulative voting is not in effect, a director who fails to receive a greater number of votes “for” his or her election than votes “withheld” from such election is required to promptly tender his or her resignation to the board of directors. The nominating committee then reviews the facts and circumstancesSelection of the resignation and recommends to the board whether to accept the resignation.However, in light of this policy, at the 2014 Annual Meeting, our shareholders showed strong support in favor of our board of directors initiating a process to amend our Articles to implement a majority voting standard for uncontested director elections. Our board of directors is proposing this majority voting standard to reflect the desire of those shareholders and reinforce our commitment to accountability and strong corporate governance practices. At its meeting on January 29, 2016, on the recommendation of our nominating committee, our board of directors unanimously adopted resolutions approving and recommending to shareholders the adoption of an amendment to our Articles to implement a majority voting standard for uncontested director elections.Under the proposed majority voting standard, for a candidate to be elected to our board of directors in an “uncontested election,” the number of votes cast “for” the candidate’s election must exceed the number of votes cast “against” his or her election. Abstentions and broker nonvotes would not be considered votes “for” or “against” a candidate. An “uncontested election” means an election in which the number of director candidates does not exceed the number of directors to be elected. In all other director elections, which we refer to as “contested elections”, a plurality voting standard would apply.Our board of directors has concluded that the adoption of the proposed majority voting standard in uncontested elections will give shareholders a greater voice in determining the composition of our board of directors by giving effect to shareholder votes “against” a director candidate and by requiring a majority of shareholder votes for a candidate to obtain or retain a seat on our board of directors. The adoption of this standard in uncontested elections is intended to reinforce the accountability of our board of directors to our shareholders voting in uncontested director elections. If adopted by our shareholders at the 2016 Annual Meeting, the majority vote standard would apply to all future uncontested director elections beginning in 2017.Our board of directors further believes that a plurality voting standard should still apply in contested director elections. If the plurality voting standard did not apply in contested elections, it is possible that more candidates could be elected than the number of director seats up for election because the proposed majority voting standard simply compares the number of “for” votes with the number of “against” votes for each director candidate without regard to voting for other candidates. Accordingly, the proposed majority voting standard retains plurality voting in contested director elections to avoid such results.If this proposal is approved by our shareholders and implemented, we expect to retain our director resignation policy (our current uncontested election policy), conformed as necessary to reflect the provisions of this proposal. Under Ohio law, an incumbent director who is not re-elected remains in office until his or her successor is elected, continuing as a “holdover” director. We expect our policy to continue to require an incumbent director who does not receive more votes “for” than “against” his or her election in an uncontested election to submit a written offer of resignation to our nominating committee, which will make a recommendation to our board of directors as to whether or not itPage 28should be accepted. Our board of directors will consider the recommendation and decide whether to accept the resignation.Our Articles currently do not address the voting standard that applies to the election of directors, which means under Ohio law that the plurality voting standard applies unless the Articles are amended. The actual text of the proposed Article THIRTEENTH to our Articles is provided below. The amendment to the Articles will become effective upon filing with the Secretary of State of Ohio, which the company expects will occur promptly following shareholder approval.If this proposal is approved by the shareholders, the following new article will be added to the Articles:THIRTEENTH. At each meeting of shareholders at which directors are to be elected, a candidate for director shall be elected only if the votes “for” the candidate exceed the votes “against” the candidate. Abstentions and broker nonvotes shall not be counted as votes “for” or “against” a candidate. Notwithstanding the foregoing, if the Board of Directors determines that the number of candidates exceeds the number of Directors to be elected, then in that election the candidates receiving the greatest number of votes shall be elected.Vote RequiredThe affirmative vote of the holders of at least two-thirds of the issued and outstanding common shares is necessary to amend the Company’s Articles to include Article THIRTEENTH, as described in this proposal. Abstentions and broker nonvotes will have the same effect as votes cast against this proposal.The Board of Directors unanimously recommends a vote FOR the proposal to approve an amendment to our Amended Articles of Incorporation implementing a majority voting standard for uncontested director elections.Page 29Proposal 3 – Ratifying the Selection of the Independent Registered Public Accounting Firm2016.2017. Although action by shareholders in this matter is not required, the audit committee believes that it is appropriate to seek shareholder ratification of this selection and to seriously consider shareholder opinion on this issue.20162017 Annual Meeting of Shareholders and will be afforded the opportunity to make any statements they wish and to answer appropriate questions. affirmative vote of a majority of the votes cast on this proposal is required for approval. Abstentions have no effect on the voting of thefor this proposal, but are counted as present for purposes of determining whether quorum requirements are met for the meeting.2016.Report of the Audit Committee2015,2016, with management, theinternal internal auditors and Deloitte & Touche LLP. The committee also discussed with management, the internal auditors and Deloitte & Touche LLP theSarbanes OxleySarbanes-Oxley Act of 2002 to accompany the company’s periodic filings with the SEC and the processes used to support management’s annual report on the company’s internal controls over financial reporting.Page 301,1. AU Section 380 and PCAOB Auditing Standard No. 16 –- Communications with Audit Committees, effective pursuant to SEC Release No. 34-68453 (December 17, 2012). The committee has received the written disclosures and the letter from Deloitte & Touche LLP required by applicable standards of the PCAOB regarding its communications with the committee concerning independence, and the committee has discussed with Deloitte & Touche LLP its independence from the company. The committee considered whether services Deloitte & Touche LLP provided to the company beyond those rendered in connection with its audit of the company’s consolidated financial statements and its reviews of the company’s interim condensed consolidated financial statements included in its Quarterly Reports on Form 10-Q were compatible with maintaining its independence. The committee also reviewed, among other things, the audit, audit-related and tax services performed by Deloitte & Touche LLP, and the amount of fees paid for such services. The committee received regular updates on the amount of fees and scope of audit, audit-related and tax services provided.2015,2016, be included in the company’s Annual Report on Form 10-K. The committee also selected Deloitte & Touche LLP as the company’s independent registered accounting firm for the fiscal year ending December 31, 2016,2017, and is presenting the selection to the shareholders for ratification at the 20162017 Annual Meeting of Shareholders.2015. Year Ended December 31, 2015 2014 Audit Fees $2,413,000 $2,319,500 Audit-Related Fees 82,500 130,000 Tax Fees 276,816 131,295 Subtotal 2,772,316 2,580,795 All Other Fees 318,000 2,800 Deloitte & Touche LLP Total Fees $3,090,316 $2,583,595 Year Ended December 31, 2016 2015 Audit Fees $ 2,510,500 $ 2,413,000 Audit-Related Fees 85,000 82,500 Tax Fees 331,847 276,816 Subtotal 2,927,347 2,772,316 All Other Fees 37,121 318,000 Deloitte & Touche LLP Total Fees $ 2,964,468 $ 3,090,316 20152016 and 2014,2015, all services rendered by the independent registered accounting firm were preapproved by the audit committee, and no fees were charged pursuant to the de minimis safe harbor exception to the preapproval requirement described in the audit committee charter.Page 31assistanceadvice (IRS examinations), sales tax and lease compliance, employee benefit tax, tax compliance and support, tax research, corporate finance modeling assistance, and allowable actuarial reviews and assistance. – - For professional services performed by the independent registered public accounting firm for the integrated audit of the company’s annual financial statements; review of financial statements included in our Form 10-K and Form 10-Q filings; and services that are normally provided in connection with statutory and regulatory filings or engagements. – - For assurance and related services performed by the independent registered public accounting firm that are reasonably related to the performance of the audit or review of our financial statements. These services include employee benefit plan audits, agreed-upon procedures and statements of actuarial opinion. – - For professional services performed by the independent registered public accounting firm with respect to tax controversy assistance,advice, tax compliance and support, tax research, employee benefit compliance and advice, and sales and use tax. None of the tax fees in 20152016 or 20142015 were related to tax advice, planning or consulting for retired executives. Our independent registered public accounting firm does not perform any tax shelter work on our behalf. – - For an audit oftraining provided to the company’s information security programinternal audit department and the company’s use of an accounting research tool.Page 32*Proposal 4 – Approval of Cincinnati Financial Corporation 2016 Stock PlanPurposeThe board of directorsNamed Executive Officerscompany has approvedSecurities Exchange Act of 1934 (Exchange Act) and recommends shareholder approvalthe related rules of the SEC. Although the say-on-pay vote is nonbinding, the compensation committee (Committee) considers the voting results as part of its annual evaluation of our executive compensation program. The annual frequency was selected by more than 88 percent of our shareholders who voted on the proposal at our 2011 Annual Meeting of Shareholders.adoptfurther segment our renewal and new business opportunities with better pricing precision and risk-selection decisions continued to benefit underwriting performance, but were offset by less favorable reserve development on prior accident years and higher losses from natural catastrophes when compared with prior year results.2016 Stock Compensation Plan (2016 Plan). The 2016 Plan would be in addition to the company’s 2006 Stock Compensation Plan (2006 Plan), approved by shareholders in 2006 and the 2012 Stock Compensation Plan (2012 Plan), approved by shareholders in 2012. The purposes of the 2016 Plan are:·To continue the compensation committee’s (Committee) flexibility to provide a mix of stock-based associate incentive compensation vehicles with different tax treatments.·To continue the Committee’s ability to provide performance-based awards. The 2016 Plan provides the Committee with flexibility to link various stock-based awards for certain executive officers and others to pre-established performance goals, including the profitability of the company’s businesses and increases in shareholder value. We believe performance-based awards under this plan can help optimize the company’s federal income tax deduction for stock-based compensation awarded to certain executives, subject to the requirements of Internal Revenue Code Section 162(m).·To help attract and retain quality associates with a strong sense of ownership in the company’s performance. The 2016 Plan encourages associates to retain shares of common stock earned through these incentives by potentially lowering their cash outlay to pay taxes, reducing the need for associates to sell shares to pay applicable income taxes for some types of awards.The total number of shares to be available under the 2016 Plan is 10 million shares of the company’s $2.00 par value common stock. Approximately 4 million of the originally authorized 7 million shares under the 2012 Plan and 500,000 of the originally authorized 10 million shares under the 2006 Plan remain available to grant to associates. The 2006 Plan is set to expire on May 5, 2016; however, any awards granted prior to that date may extend beyond it.The board of directors wishes to continue extending equity ownership beyond the company’s executives to all levels of associates, potentially including hourly associates. To best serve shareholders for the long term, the board seeks to align the interests of associates with the interests of shareholders.Historically, stock-based awards have translated into ownership as most associates generally hold their shares, funding the option purchases without cashing in a portion of the grant. The company’s associates have a direct stake in building future success for your company. Although the company does not have access to information about broker accounts, we estimate that approximately 80 percent of our associates hold shares of Cincinnati Financial Corporation.*In our disclosure about compensation paid to our named executive officers we refer to several Non-GAAP measures, including “operating income,” “net written premiums” and “value creation ratio.” The Definitions of Non-GAAP Information and Reconciliation to Comparable GAAP Measures are attached to this proxy statement in Appendix A.Page 33We believe that, had the 2016 Plan been in effect in fiscal year 2015, the amount of awards granted under the 2016 Plan in 2015 would not have been materially different than the amounts granted under the existing 2012 and 2006 Plans, as displayed in the table below:Name and Position Dollar Value of Number of Stock Dollar Value of Number of Stock Options Options Restricted Stock Restricted Stock ($) (#) Units at Target Units at Target (Performance and (Performance and Service Vesting) Service Vesting) ($) (#) Steven J. Johnston Chief Executive Officer
and President
Cincinnati Financial Corporation151,834 13,573 664,794 14,478 Jacob F. Scherer, Jr. Chief Insurance Officer and
Executive Vice President
The Cincinnati Insurance Company90,465 8,087 410,264 8,917 Michael J. Sewell Chief Financial Officer,
Senior Vice President and Treasurer
Cincinnati Financial Corporation80,599 7,205 365,496 7,944 Martin F. Hollenbeck Chief Investment Officer and
Senior Vice President
Cincinnati Financial Corporation66,437 5,939 301,316 6,549 Charles P. Stoneburner II Senior Vice President
The Cincinnati Insurance Company66,437 5,939 301,316 6,549 Total Executive Group (1) 902,370 80,666 4,096,531 89,032 Nonexecutive Director Group - - - - Nonexecutive Officer Employee Group (2) 3,400,019 305,147 15,292,557 325,166 (1)These awards to executive officers, including those listed in the table above, were granted under the 2012 Plan. No awards were granted to executive officers under the 2006 Plan during the 2015 fiscal year. (2)These awards include grants to nonexecutive officer employees under both the 2012 and 2006 Plans.2016 Plan DescriptionThe 2016 Plan provides for grants of various types of stock-based awards to associates of the company and its subsidiaries who are selected by the Committee of the board of directors. Awards in any form other than stock options would be counted against the 10 million share limit as three shares for every one share granted. The 2016 Plan is presented in Appendix B, beginning on Page 70.The awards to be made in the future to participants will be decided at that time and cannot be determined at this time. The actual awards depend on a number of factors, including the company’s performance, an individual’s potential contribution to the business, compensation practices at the time, retention considerations and the company’s stock price.Eligibility.All associates of the company and its subsidiaries are eligible to receive awards under the 2016 Plan. Approximately 4,500 associates currently would be eligible under the 2016 Plan.Plan Administration. The 2016 Plan is an unfunded plan and will be administered by the Committee, which must include at least two directors who are “nonemployee directors” within the meaning of SEC Rule 16b-3 and who are “outside directors” for purposes of Section 162(m) of the Internal Revenue Code.Performance Goals. Under Section 162(m) of the Internal Revenue Code, compensation in excess of $1 million paid in any year to any “covered employee” (as defined by Section 162(m)) is deductible by the company if it is based on the achievement of pre-established performance goals and meets certain other requirements of the rules. The Committee has adopted performance goals under which awards under the 2016 Plan for covered employees could be performance based and therefore could be fully deductible and not subject to the limitations of Section 162(m). The performance goals for performance awards of stock-based incentive compensation under thePage 342016 Plan (whether such awards take the form of stock, stock units, or equivalents or cash) made (or paid) to any eligible associate would consist of objective tests derived from one or more of the following: earnings per share, total shareholder return, operating income, net income, adjusted net earnings, cash flow, return on equity, return on capital, combined ratio, premium growth, investment performance and/or value creation ratio. The specific performance goal and applicable performance targets and payout opportunities are set forth in each grant agreement, along with other terms and conditions. The Committee sets the performance targets within the first 90 days of the calendar year to which the goals apply. Performance goals may be measured solely on a corporate, subsidiary or business unit basis, or a combination thereof. Further, performance goals may reflect absolute company performance or a relative comparison of company performance to the performance of a peer group or other external measure of the selected performance goals.Types of Awards. The 2016 Plan provides for stock incentives of several types, including stock options, stock appreciation rights, restricted stock, restricted stock units and other stock-based awards. Awards of all types may be made subject to performance goals established by the Committee.Stock options granted under the 2016 Plan may either be incentive stock options qualifying under Section 422 of the Internal Revenue Code or nonqualified options, both exercisable for the company’s $2.00 par value common stock. At the time of grant, the Committee determines the exercise price for options granted under the 2016 Plan, which may not be less than fair market value of the company’s common stock at that date. As of February 29, 2016, the Nasdaq Global Select Market’s closing price for the company’s stock was $63.14.The Committee also determines the term of each option, which may not exceed 10 years from the date of grant. Options become exercisable in accordance with a vesting schedule established by the Committee at the time of grant. Depending on the type of option, the Committee may permit an option to be exercised by the participant either for a cash payment or the delivery of shares of the company’s common stock held by the participant, potentially including shares acquired upon exercise of the option.As under the company’s prior stock plans, the aggregate fair market value cannot exceed $100,000, determined at the time of grant, for the shares of common stock an associate may acquire through incentive stock options that become exercisable for the first time during any calendar year. Additionally, the Committee may not grant an amount of stock options to any one plan participant during any single calendar year that may be converted into more than 100,000 shares of common stock. At its sole discretion, the Committee may provide, at the time of grant, that the shares to be issued upon an option’s exercise be in the form of restricted stock or other similar securities, or the Committee may reserve the right to so provide after the time of grant.In general, if a plan participant’s employment is terminated, other than for death, disability, retirement or specified actions initiated by the company, all of the participant’s unexerciseable options are forfeited and all exercisable options also will be forfeited unless exercised before the participants termination date.Shares of restricted common stock also may be awarded. The restricted stock vests and becomes transferable upon the satisfaction of conditions set forth in the restricted stock award agreement. Restricted stock awards may be forfeited if, for example, the recipient’s employment terminates before the award vests. Except as specified in the restricted stock award agreement, the holder of a restricted stock award has all the rights of a holder of common stock, including the right to receive dividends on the restricted shares.Restricted stock units representing the right to receive common stock, cash, or both (as the Committee determines) also may be awarded. Restricted stock units vest upon the satisfaction of conditions specified in the award agreements. Restricted stock units may be forfeited if, for example, the recipient’s employment terminates before the award vests. Except as specified, the holder of a restricted stock unit or award has none of the rights of a holder of common stock unless and until shares of common stock are actually delivered in satisfaction of such units. The Committee may not grant more than 100,000 common shares worth of restricted stock and restricted stock units to any one plan participant during any single calendar year.Page 35Stock appreciation rights (or SARs) may be granted either singly or in combination with underlying stock options. SARs entitle the holder upon exercise to receive an amount in any combination of cash or shares of common stock (as the Committee determines) equal in value to the excess of the fair market value of the shares covered by such right over the grant price. The grant price for SARs may not be less than the fair market value of the common stock on the date of grant.The 2016 Plan also provides for other potential awards that may be denominated in, valued by reference to, or otherwise based on or related to, common stock. The Committee specifies the terms of grant, purchase, exercise, exchange or conversion of other stock-based awards. These awards may include, for example, performance shares that entitle the recipient to receive, upon satisfaction of performance goals or other conditions, a specified number of shares of common stock or the cash equivalent thereof. Where the value of such stock-based award is based on the difference between the fair market value of the shares covered by such award and the exercise price, the grant price for such award may not be less than the fair market value on the date of grant. The Committee may not grant more than 100,000 common shares worth of SARs and other stock-based compensation to any one plan participant during any single calendar year.Performance-based awards may be issued to participants for no cash consideration or for such minimum consideration as may be required by applicable law, either alone or in addition to other awards granted under the plan. The Committee determines the performance goals and associated performance targets to be achieved during any performance period under the 2016 Plan and the length of the performance period. Performance awards are generally paid only after the end of the relevant performance period. Performance awards may be paid in cash, shares of common stock, other property or any combination thereof, as the Committee determines, in its sole discretion, at the time of payment. Performance awards may be paid in a lump sum or in installments following the close of the performance period.Acceleration of Awards Provisions. In the event an associate’s employment is terminated within 12 months after the effective date of and due to a change in control as defined in the 2016 Plan, all stock options and SARs held by the associate as of the date of termination would become fully vested and immediately exercisable; the restrictions applicable to outstanding restricted stock, restricted stock units, and other stock-based awards would lapse; and the awards would become free of all restrictions and fully vested.Amendment and Termination. The board of directors can amend the 2016 Plan to meet changes in law or regulations or for any other purpose that at the time may be permitted by law, except that the total number of shares to be issued through the plan may not increase and the board may not decrease the participant’s exercise price of stock options, SARs or other stock-based awards to an amount less than the fair market value on the date of the grant. Additionally, the Committee may not cancel any issued stock option, SAR or other stock-based award and replace it with a lower grant price, cash or other awards, without shareholder approval.Proceeds. The proceeds from the sale to participants of common stock upon the exercise of any and all stock options and any other stock-based compensation issued under the 2016 Plan constitute general funds of the company and may be used by it for any purpose.Clawback. Any awards granted under the 2016 Plan will be subject to reduction, cancellation, forfeiture or recoupment to the extent required by applicable laws, regulations, stock exchange listing rules, company policies or to the extent otherwise provided in an award agreement at the time of grant.Accounting and Federal Income TaxThe board of directors recognizes that shareholders are interested in the impact of stock option expense on net income. Since 1996, following Financial Accounting Standards Board (FASB) accounting standards, the company has clearly disclosed the estimated impact of stock options on net income and earnings per share in a Note to the Financial Statements and fully complied with amended requirements for disclosures in quarterly financial statements. The company has adopted FASB Accounting Standards Codification (ASC) 718, Compensation – Stock Compensation, which calls for stock option expense to be included as a component of net income.Page 36Corporate Federal Income Tax. To the extent that a participant recognizes ordinary income in the circumstances described below, the company is entitled to a corresponding deduction provided that, among other things: (i) the income meets the test of reasonableness, is an ordinary and necessary business expense and is not an “excess parachute payment” within the meaning of Section 280G of the Internal Revenue Code and is not disallowed by the $1 million limitation under Section 162(m) of the Internal Revenue Code on compensation paid to specified executive officers and (ii) any applicable reporting obligations are satisfied. Section 162(m) of the Internal Revenue Code limits the federal income tax deduction for compensation paid to the chief executive officer and the four other most highly compensated executive officers of a publicly held corporation (covered employees) to $1 million per fiscal year, with exceptions for certain performance-based compensation made under qualifying, shareholder-approved plans. Our intention in designing the 2016 Plan is that all stock option awards, as well as restricted stock awards, performance awards and other stock unit awards granted subject to performance goals, can constitute performance-based compensation for purposes of Section 162(m).Participant Federal Income Tax. In general, an optionee recognizes no income at the time a nonqualified option is granted; at the time of exercise of a nonqualified option, the optionee recognizes ordinary income for the difference between the purchase price paid for the shares and the fair market value of the nonrestricted shares on the date of exercise; and at the time of sale of shares acquired through the exercise of a nonqualified option, any appreciation (or depreciation) in the value of the shares after the date of exercise is treated as either short-term or long-term capital gain (or loss) depending on how long the participant has held the shares.An optionee generally recognizes no income upon the grant or qualifying exercise of an incentive stock option. However, for purposes of calculating the optionee’s alternative minimum tax, if any, the difference between the fair market value of the shares at exercise and the purchase price constitutes an item of adjustment. If the optionee makes no disqualifying disposition, shares acquired through exercise of an incentive option within two years after the grant date or within one year after the transfer of the shares to the optionee, then any proceeds from selling the shares in excess of the purchase price are taxed to the optionee as long-term capital gain and any loss sustained is a long-term capital loss. If shares acquired upon the exercise of an incentive stock option are disposed of prior to the expiration holding period described above, the optionee generally recognizes ordinary income in the year of disposition in an amount equal to any excess of the fair market value over the purchase price at the time of exercise (or, if less, the amount realized on the disposition of the shares in a sale or exchange). Any further gain or loss realized by the optionee generally is taxed as short-term or long-term gain or loss, depending on the holding period.A participant recognizes no income in connection with the grant of a SAR. When the SAR is exercised, the participant normally is required to include as taxable ordinary income in the year of exercise the total amount of any cash plus the fair market value of any nonrestricted shares received2017 Annual Shareholder Meeting pursuant to the exercise.A recipient of a restricted common stock award generally is subject to tax at ordinary income rates on the fair market valuecompensation disclosure rules of the restricted shares reduced by any amountSEC, including the recipient pays forCompensation Discussion and Analysis, the shares, at such time as2016 Summary Compensation Table and the shares are no longer subject to a substantial risk of forfeiture or restrictions on transfer for purposes of Section 83 of the Internal Revenue Code. However, a recipient who so elects under Section 83(b) of the Internal Revenue Code within 30 days of the date of receipt of the shares has taxable ordinary income on the date of receipt equal to the excess of the fair market value of the shares (determined without regard to the risk of forfeiture or restrictions on transfer) over any purchase price paid for the shares. If a Section 83(b) election has not been made, any dividends received with respect to restricted shares that are subject at that time to a substantial risk of forfeitureother related tables and restrictions on transfer generally are treated as taxable ordinary income to the recipient.Generally, a participant recognizes no income in connection with the grant of a restricted stock unit or any performance-based award. Subject to the specific terms of the award, when the award is paid to the participant, the participant normally is required to include as taxable ordinary income in the year of payment the total amount of any cash plus the fair market value of any nonrestricted shares of common stock, actually or constructively received.Page 37SummaryBy adding the proposed 2016 Plan to the shares remaining in the current 2012 Plan and 2006 Plan, your company can continue offering a mix of stock-based incentives. The 2016 Plan would continue to accommodate performance-based awards, provide opportunities to optimize the company’s tax deductions and encourage associates to be vested owners whose interests are aligned with those of other shareholders.The board of directors recommends a vote FOR the proposal to adopt the Cincinnati Financial Corporation 2016 Stock Compensation Plan.Page 38Proposal 5 – Say-on-Pay: Advisory Vote on Compensation of Named Executive OfficersWe conduct a say-on-pay vote each year at the annual shareholder meeting. This say-on-pay vote is required by Section 14A of the Securities Exchange Act of 1934 (Exchange Act). Although the say-on-pay vote is nonbinding, the compensation committee (Committee) considers the voting results as part of its annual evaluation of our executive compensation program. The annual frequency was selected by over 88 percent of our shareholders who voted on the proposal at our 2011 Annual Meeting of Shareholders.As we describe in the Executive Summary of our Compensation Discussion and Analysis, Page 40, in 2015, the company delivered strong operating results and acceptable short-term financial performance in a volatile investment environment. Highlights included:·A combined ratio of 91.1 percent, the fourth consecutive year of underwriting profit. In 2015, our efforts to further segment our renewal and new business opportunities with better pricing precision and risk-selection decisions continued to improve underwriting performance. More favorable weather in 2015 also benefited underwriting profits.·A 21 percent increase in net income to $634 million.·A 5 percent increase in consolidated property casualty net written premiums, including 1 percent from our new reinsurance assumed operations. The increase in premiums also reflects other growth initiatives, modest average price increases and a higher level of insured exposures.·Less than a 1 percent full-year increase in fair value of invested assets at December 31, 2015, including a 3 percent decrease for the stock portfolio and a 2 percent increase for the bond portfolio.·A 4 percent increase in pretax investment income, net of expenses, reflecting a 9 percent increase in equity portfolio dividends and a 3 percent growth in interest income.·A decrease of less than a dollar in book value at December 31, 2015, to $39.20 per share compared with book value of $40.14 per share at December 31, 2014.·A value creation ratio (VCR) of 3.4 percent, below our announced goal of producing an annual average VCR of 10 percent to 13 percent for the five-year period from 2013 to 2017. A volatile equities market offset strong operating results and lowered our VCR. Our VCR exceeded the VCR of four of the 10 companies in our peer group.·At December 31, 2015, our one-year total shareholder return of 19.0 percent exceeded that measure for six of the 10 companies in the peer group and our cumulative three-year total shareholder return of 69.07 percent exceeded that measure for four of the 10 companies in our peer group.For our shareholders, these efforts supported an increase of our regular annual cash dividend for the 55th consecutive year and payment of a special cash dividend of $0.46 per share in the fourth quarter of 2015. Through the cash dividends paid and share repurchases, we returned $419 million to shareholders in 2015, and $1.033 billion during the three years ended December 31, 2015.For our executives, these efforts resulted in payouts of performance-based equity and nonequity incentive compensation at threshold levels, as the company’s strong operating results were muted by the effects of the financial markets.In addition to these highlights, please read the Compensation Discussion and Analysis section for more detailed information about our executive compensation program and decisions to inform your vote on the following say-on-pay proposal:“RESOLVED, that the company’s shareholders approve, on an advisory basis, the compensation of the named executive officers, as disclosed in the company’s proxy statement for the Cincinnati Financial Corporation 2016 Annual Shareholder Meeting pursuant to the compensation disclosure rules of the SEC, including the Compensation Discussion and Analysis, the 2015 Summary Compensation Table and the other related tables and narrative disclosure.”Page 39Vote RequiredThe affirmative vote of a majority of the shares represented in person or by proxy at the Annual Meeting that are entitled to vote on this proposal is required for approval. Votes to abstain have the same effect as votes against the proposal. Broker nonvotes have no effect on the voting for this proposal.Report of the Compensation Committee20162017 proxy statement.2015,2016, W. Rodney McMullen, William F. Bahl, Gregory T. Bier, Dirk J. Debbink and Gretchen W. Price served on the compensation committee. During the 20152016 fiscal year, none of the compensation committee members were officers, employees or former officers of Cincinnati Financial Corporation.Compensation Discussion and Analysis2015,2016, who were:were:Name Title Steven J. Johnston President and Chief Executive Officer Jacob F. Scherer Chief Insurance Officer and Executive Vice President Michael J. Sewell Chief Financial Officer and Senior Vice President Chief Investment Officer and Senior Vice President Charles P. Stoneburner II Senior Vice President, Commercial Lines Executive Summaryalso believePage 4020152015,2016, the company delivered strong operating results and acceptable short-term financial performance that benefited shareholders with one-year and three-year total shareholder return of 31.5 percent and 60.6 percent respectively; a 10 percent increase in book value; and a volatile4.3 percent increase in regular cash dividends, excluding the special cash dividend declared in the fourth quarter of 2015. This strong performance generated payouts of annual incentive compensation at the maximum level and payouts of performance restricted stock units at target levels for our named executive officers. Highlights of our company's strong year included:environment. Highlights included:·A combined ratio of 91.1 percent, the fourth consecutive year of underwriting profit. In 2015, our efforts to further segment our renewal and new business opportunitiesgains. better pricing precision and risk-selection decisions continued to improve underwriting performance. More favorable weather in 2015 also benefited underwriting profits.·A 21 percent increase in net income to $634 million.·A 5 percent increase in consolidated property casualty net written premiums, including 1 percent from our new reinsurance assumed operations. The increase in premiums also reflects other growth initiatives, modest average price increases and a higher level of insured exposures.·Less than a 1 percent full-year increase in fair value of invested assets at December 31, 2015, including a 3 percent decrease for the stock portfolio and a 2 percent increase for the bond portfolio.·A 4 percent increase in pretax investment income, net of expenses, reflecting a 9 percent increase in equity portfolio dividends and a 3 percent growth in interest income.·A decrease of less than a dollar in book value at December 31, 2015, to $39.20 per share compared with book value of $40.14 per share at December 31, 2014.·A value creation ratio (VCR) of 3.4 percent, below our announced goal of producing an annual average VCR of 10 percent to 13 percent for the five-year period from 2013 to 2017. A volatile equities market offset strong operating results and lowered our VCR. Our VCR exceeded the VCR of four of the 10 companies in our peer group.·At December 31, 2015, our one-year total shareholder return of 19.0 percent exceeded that measure for six of the 10 companies in the peer group and our cumulative three-year total shareholder return of 69.07 percent exceeded that measure for four of the 10 companies in our peer group.·A 31 percent increase to $2.30 per share in cash dividends declared, including a special cash dividend of $0.46 per share declared in the fourth quarter of 2015.For our shareholders, these efforts supported an increase of our regular annual cash dividend for the 5556thconsecutive year and payment of a special cash dividend of $0.46 per share in the fourth quarter of 2015.year. Through the cash dividends paid and share repurchases made during the year, we returned $419$345 million to shareholders in 2015,2016, and $1.033$1.063 billion during the three years ended December 31, 2015.2015.Page 41
CEO Pay for Performance 2013 2014 2015 SCT Total Compensation $ 3,501,957 $ 2,623,807 $ 2,163,984 Realized Compensation(1) $ 2,971,137 $ 2,434,715 $ 1,936,016 1-Year VCR 16.1% 12.6% 3.4% 3-Year Total Shareholder Return(2) 88.6% 90.6% 69.1% CEO Pay for Performance 2014 2015 2016 SCT Total Compensation $ 2,623,807 $ 2,163,984 $ 4,249,903 $ 2,434,715 $ 1,936,016 $ 3,711,998 1-Year VCR 12.6 % 3.4 % 14.5 % 90.6 % 69.1 % 60.6 % (1) Realized compensation is the sum of salary and annual incentive cash compensation reported in the Summary Compensation Table for the year plus the value realized from the exercise of stock options and vesting of time-vesting or performance-based restricted stock units, if any, reported in the Option Exercises and Stock Vested table for the yearyear.(2) 3-Year Total Shareholder Return is total shareholder return for the 3-year performance period ending December 31 of a given year, as calculated by and displayed on Bloomberg LP.
Compensation Performance
Relative to PeerCompaniesPerformance LevelEarned PerformanceRelative to Peer
CompaniesPerformance Level
EarnedPerformance Relative to Peer Companies Performance Level Earned 2016 > 9 Peers* Maximum > 5 Peers Target 2015 > 4 Peers ThreshholdThreshold> 4 Peers ThreshholdThreshold2014 > 6 Peers Target > 6 Peers Target 2013>9 Peers* Maximum> 10 PeersMaximumFor the annual performance period ending December 31, 2016, the company's VCR exceeded that of eight Peer Group companies and achievement of the additional performance goals for net written premium growth and combined ratio added one additional peer placement. For annual performance periods ending December 31, 2015 and 2014, annual incentive compensation payouts were determined by the company's performance based on the single performance metric of relative VCR.ranked slightly belowexceeded the median of the 10nine companies of our peer group as measured by three-year total shareholder return. As suggested by the Three-Year Relative Pay for Performance graph below, total realizable compensation†2 for our chief executive officer and the other named executive officers over the same period remains comparatively low, ranking near the 25th percentile, largely reflecting the size of several of the companies included in the peer group. Because we do not benchmark executive compensation to the peer group, our performance is judged against those companies with whom we compete every day for each insurance policy we write, regardless of the size of those companies.†Three-year total realizable compensation is the sum of the following components of compensation as reported and calculated by Equilar: salary paid, discretionary cash bonus, nonequity incentive compensation paid, amounts realized from the exercise of stock options or vesting of stock awards, the intrinsic value of exercisable “in the money” stock options and the grant date fair value of time vesting and target-level performance-based restricted stock or restricted stock unit awards, for the three years ending December 31, 2014, the most recent year for which such data is available.Page 42(2013-2015) 
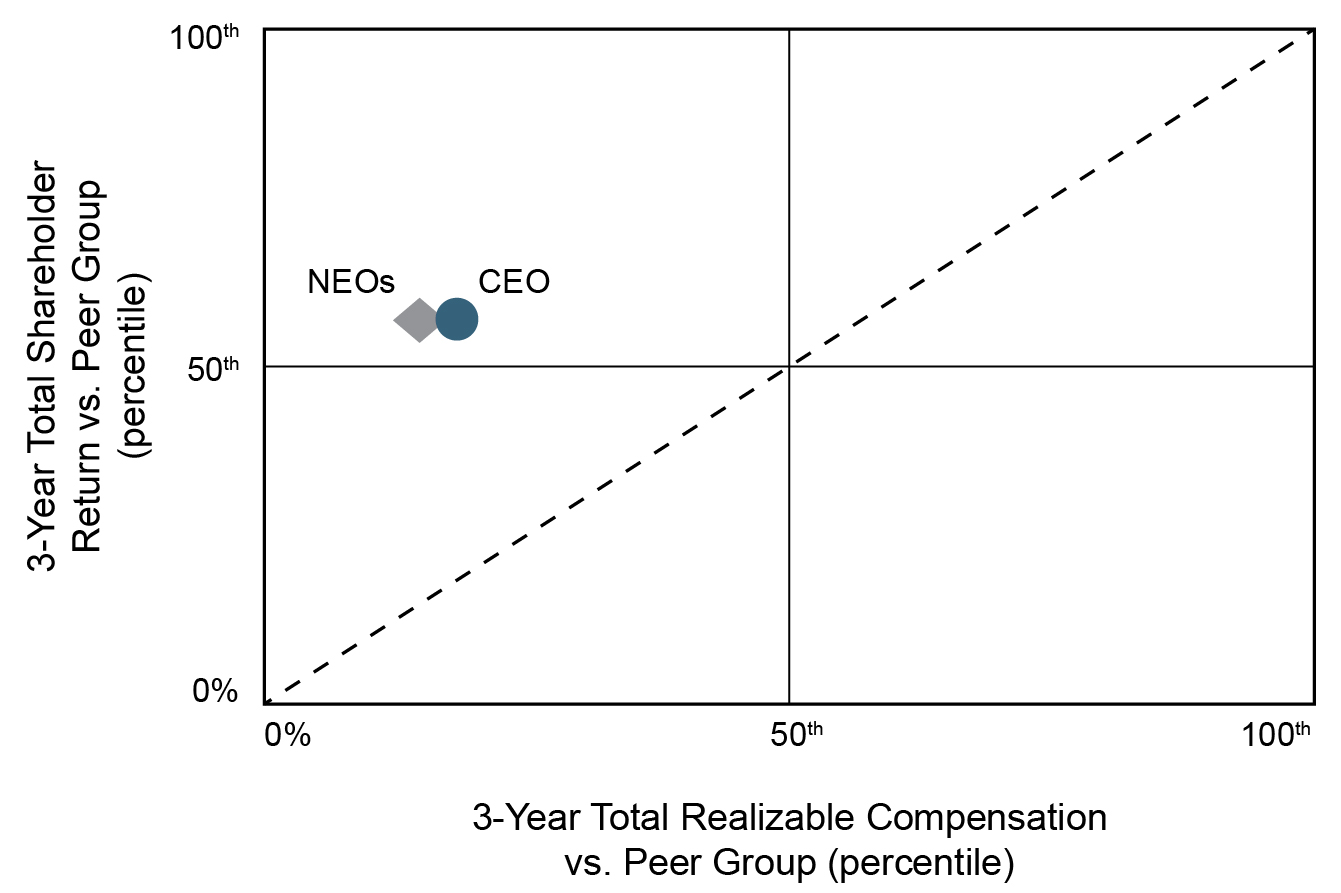
20152016 Advisory Vote to Approve Executive Compensation20152016 Annual Meeting of Shareholders, nearly 98more than 97 percent of the votes cast were in favor of this proposal. The Committee believed this favorable outcome demonstrated support of its decisions and our overall executive compensation program. SubsequentOur annual discussions with investors representing approximately 30 percent of the shares outstanding confirmedconfirm this belief. All of the shareholders contacted during our annual investor engagement efforts in 2016 favorably commented on the company’s executive compensation program, criteria for performance-based awards and overall level of pay. As a result, theThe Committee made no material changes in the structure of our compensation program in 2015.2016 as a result of feedback from investors, but it did introduce additional performance objectives to the annual incentive compensation awards to add emphasis and weight to key operational metrics (see Page 46). At the 20162017 Annual Meeting of Shareholders, we will again hold an advisory vote to approve executive compensation (see Page 39)37). The Committee will continue to consider the results of these annual advisory votes and feedback from investor outreach in its deliberations about our executive compensation program.Page 43committeeCommittee applies certain fundamentals that are key characteristics of our overall compensation program, including:We Do We Don’t Link Pay to Performance –- The majority of pay awarded by the Committee to each executive officer each year is tied to achievement of short- and long-term performance objectives and changes in the market value of the company’s common stock.Use Employment Contracts –- We employ all of our executive officers at will.Review Data Sheets –- Each year the Committee reviews data recounting the compensation history for each executive officer. For the named executive officers, the Committee additionally reviews compensation and performance data for the companies in the peer group before making executive compensation decisions.Pay Dividends or Dividend Equivalents –- We do not pay dividends or dividend equivalents on unvested stock awards.Mitigate Excessive Risk –- Compensation earned from performance-based awards is capped and is subject to clawback policies and provisions. Company-level performance objectives relative to peers minimizes the ability of any single individual or business unit to control its own performance-based compensation. The Committee’s authority to exercise negative discretion and eliminate payment of any award also is a powerful risk control.Reprice or Exchange Stock Options –- We do not reprice or exchange stock options. We consider stock options to be performance-based compensation that links the financial success of our associates to shareholders. Since shareholders cannot reprice or exchange their shares, neither do we.Use Double-Trigger Change in Control Provisions –- Both our annual incentive and stock-based compensation plans include double-trigger change in control provisions.Include Stock-Based Awards in Calculations for Pension or Other Retirement Benefits –- Our pension is calculated based on salary only, and our matches to 401(k) and Top Hat Savings Plan contributions are limited to cash compensation.Perform Compensation Risk Assessments –- Our chief risk officer performs this assessment each year, and it is considered by the Committee as part of its decision making process.Allow Hedging Transactions by Executive Officers or Directors –- Our Securities Trading Policy prohibits transactions such as short sales, prepaid forward sales contracts or other hedging transactions that we believe decouple the director’s or officer’s interests from those shared by our shareholders generally.Track Compliance Withwith Ownership Guidelines –- All of our directors and executive officers satisfyare in compliance with our published stock ownership guidelines. Page 44Components of Compensation2015, 702016, approximately 71 percent of TDC awarded to the chief executive officer and 6160 percent of the TDC awarded to the other named executive officers was considered performance-based and not guaranteed.

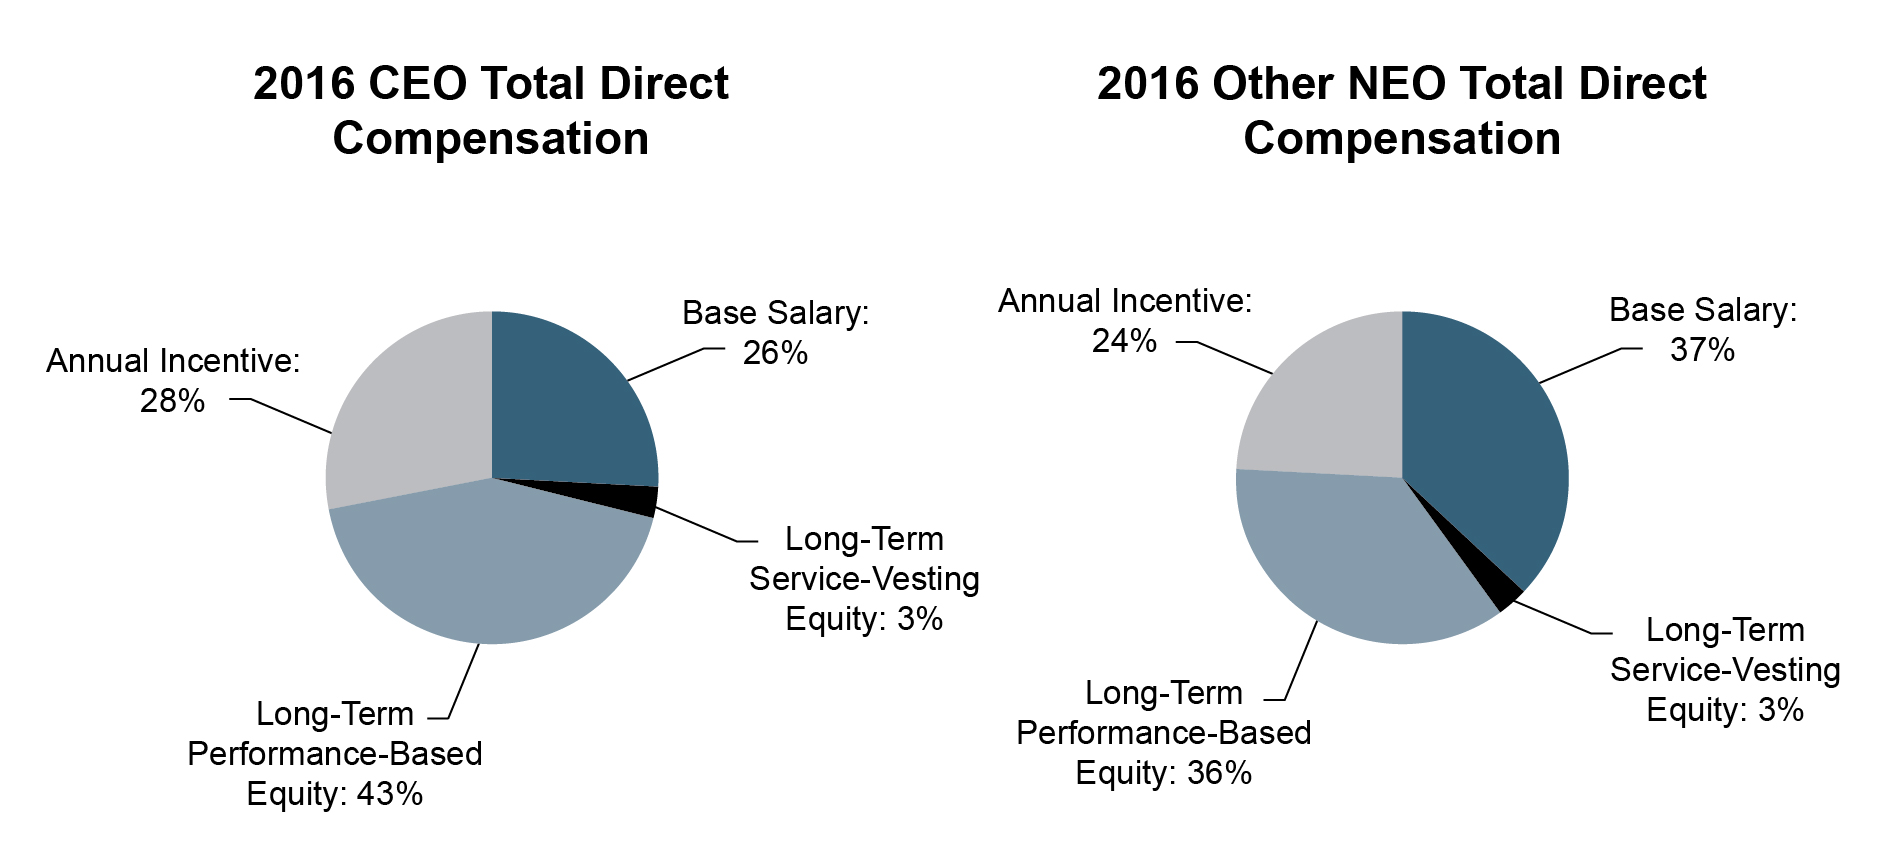
·The officer’s role and responsibilities,·Fairness, as compared with officers with similar responsibilities, experience and performance,·Current compensation level, and·Individual performance.20152016 to recognize the strong individual contribution of each officer to the company’s strong performance in the prior year. On average, base annual salary for the group increased approximately 2.22.6 percent. On an individual basis, each named executive officer’s salary was adjusted as follows:·For Mr. Johnston, an increase of 2.0 percent to $945,540;·For Mr. Scherer, an increase of 2.0 percent to $866,745;·For Mr. Sewell, an increase of 2.0 percent to $772,191;·For Mr. Hollenbeck, an increase of 2.5 percent to $636,525; and·For Mr. Stoneburner, an increase of 2.5 percent to $636,525.Page 45Sinceperformance objectiveCommittee used for annual incentive compensation awards is our one-year value creation ratio (VCR) relative to our peer group.group as the single performance objective for our annual incentive compensation awards. We believe this measure captures the contribution of our insurance operations, the success of our investment strategy and the importance we place on paying cash dividends to shareholders. The value creation ratio is a two-part metric: i)1) our rate of growth in book value per share, plus ii)2) the ratio of dividends declared per share to beginning book value per share. For the period 2013 through 2017, we are targeting an annual value creation ratio averaging 10 percent to 13 percent as our primary performance goal.TheIn 2016, the percentage of salary ranged from 65 percent to 100110 percent based on the named executive officer’s tier. Assignment to a particular tier was based on level of responsibility. In 2015,2016, Mr. Johnston was assigned to the chief executive officer’s tier for which the target level award was 100110 percent of base annual salary. All of the otherThe remaining named executive officers were assigned to Tier I for which target level awards were 65 percent of base annual salary.◦ When the combined ratio is 95.0 percent or better, the company's baseline award placement improves by one placement. ◦ When the combined ratio is 93.0 percent or better, the company's baseline award placement improves by two placements. ◦ When the combined ratio is 91.0 percent or better, the company's baseline award placement improves by three placements. company’s value creation ratiofinal award placement must exceed that of three of the 10nine peer companies to achieve the threshold hurdle, must equal or exceed five peer companies to achieve the target hurdle and must equal or exceed eightseven peer companies to achieve the maximum hurdle. Achievement of threshold, target and maximum performance hurdles earns award payouts of 30 percent, 100 percent and 200 percent, respectively, of target.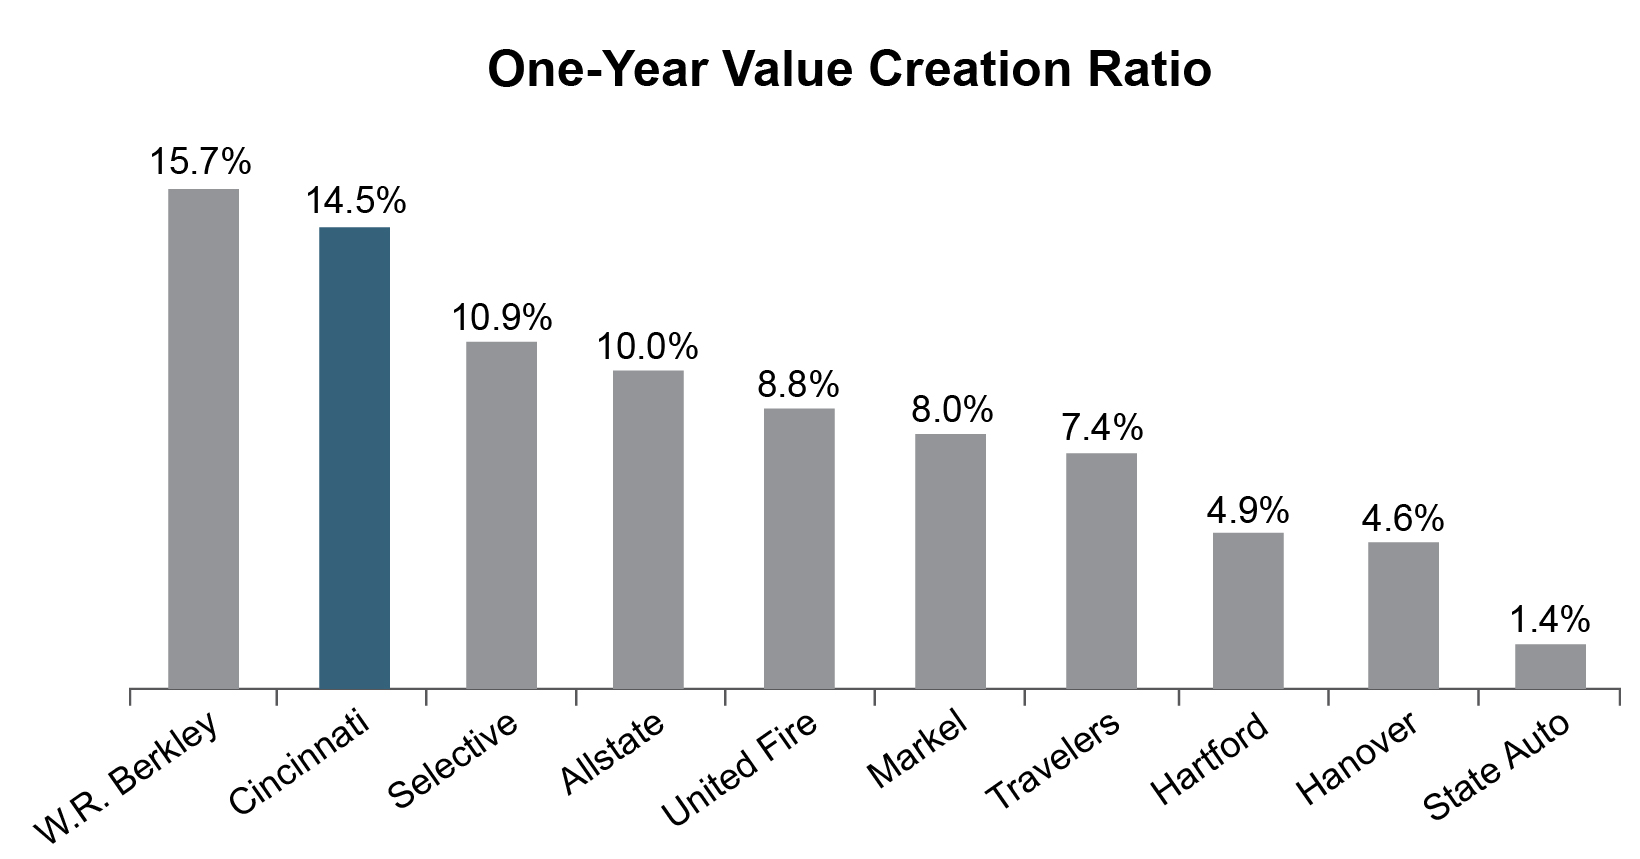
–- 200%)As shown in the following chart, for 2015, the company achieved a value creation ratio of 3.4 percent and exceeded the value creation ratio achieved by four of the 10 peer companies, qualifying for threshold-level payouts of 30 percent of target.
Page 462015.Name Base Annual Salary
($)Tier Target
% of Base Annual Salary2015 Performance Factor
(Threshold)
(%)2015 Annual Incentive
Cash Compensation
($)Steven J. Johnston 945,540 100 30 283,662 Jacob F. Scherer, Jr. 866,745 65 30 169,015 Michael J. Sewell 772,191 65 30 150,577 Martin F. Hollenbeck 636,525 65 30 124,122 Charles P. Stoneburner II 636,525 65 30 124,122 Name Base Annual Salary
($)Tier Target
% of Base Annual Salary2016 Performance Factor
(Maximum)
(%)2016 Annual Incentive Cash Compensation
($)Steven J. Johnston 964,451 110 200 2,121,792 Jacob F. Scherer, Jr. 892,747 65 200 1,160,572 Michael J. Sewell 787,635 65 200 1,023,925 Martin F. Hollenbeck 649,256 65 200 844,032 Charles P. Stoneburner II 661,986 65 200 860,582 2015February 2016, totaled less than 1 percent of total shares outstanding. In 2015,2016, approximately 1817 percent of all stock-based awards were granted to the company’s executive officers, including the named executive officers, and approximately 8283 percent were granted to more than 3,000 other company associates. All stock-based awards are granted at 100 percent of fair value on the date of grant.strengthensstrengthen the alignment of financial interests shared by executives and shareholders. Both stock options and PSUs can qualify as performance-based, tax-deductible executive compensation. The named executive officers also are eligible to receive shares under the Holiday Stock Plan. We do not pay dividends or dividend equivalents on unvested stock-based awards. – - For the named executive officers, the Committee uses nonqualified stock options that vest and become exercisable in equal amounts over the three years following the grant date. We consider stock options to be performance-based compensation, because the associate recognizes value only if the market value of our stock appreciates over time. Stock options tie the compensation realized from such awards, if any, to changes in the stock price experienced by shareholders generally. When the stock price does not increase, the stock options do not have value. We do not, and have not, backdated, repriced or exchanged stock options. – - For the named executive officers, the Committee uses PSUs that cliff vest after three years if performance targets are achieved. PSUs tie vesting of a portion of stock-based compensation to performance goals, and the three-year performance period for awards of PSUs reinforces the company’s long-term focus and matches the period after which stock option awards are fully vestedPage 47– - For the named executive officers, the Committee uses RSUs that ratably vest in thirds over three years. The Committee added RSUs as a regular component of compensation for the named executive officers beginning in 2015 to place greater emphasis on long-term compensation and strengthen the alignment of executive officer and shareholder financial interests.2015,2016, the percentage of salary ranged from 97.5 percent to 150 percent based on the named executive officer’s tier. Assignment to a particular tier was based on level of responsibility. In 2015,2016, Mr. Johnston was assigned to the chief executive officer’s tier for which the target level award was 150 percent of base annual salary. All of the otherThe remaining named executive officers were assigned to Tier I for which target level awards were 97.5 percent of base annual salary. The target dollar amount is then allocated between stock options and PSUs, and the target dollar amount for each is then divided by the fair value of the company’s stock on the date of grant to determine the target number of shares for each award. For 2015,2016, the target value for stock awards was allocated 50 percent to PSUs and 50 percent to stock options. The following formula isBase Annual Salary X Tier Target % X Award Allocation % = Target # of Shares Underlying Award Grant Date Fair Value 2015,2016, the percentage of salary for each named executive officer was 510 percent. The following formula is used to calculate the number of shares underlying each grant of RSUs:Base Annual Salary X 5%10%= # of Shares Underlying Award Grant Date Fair Value The Committee believes that its method for determining the number of shares for each stock-based award helps to conserve the number of shares available for grant under the shareholder approved plans.Page 48201513, 2015,12, 2016, the Committee granted the following stock-based awards to the named executive officers:Name # Nonqualified Stock Options # PSUs # RSUs Steven J. Johnston 13,573 13,573 905 Jacob F. Scherer, Jr. 8,087 8,087 830 Michael J. Sewell 7,205 7,205 739 Martin F. Hollenbeck 5,939 5,939 610 Charles P. Stoneburner II 5,939 5,939 610 Name # Nonqualified Stock Options # PSUs # RSUs Steven J. Johnston 11,768 11,768 1,569 Jacob F. Scherer, Jr. 7,081 7,081 1,453 Michael J. Sewell 6,247 6,247 1,282 Martin F. Hollenbeck 5,150 5,150 1,057 Charles P. Stoneburner II 5,251 5,251 1,077 2015,2016, performance hurdles for threshold, target and maximum awards were set at the 30th, 50th and 75th percentiles, respectively, of the peer group. Stated another way, the company’s three-year total shareholder return must exceed that of three of the 10nine peer companies to achieve the threshold hurdle, must equal or exceed that of five peer companies to achieve the target hurdle and must equal or exceed that of eightseven peer companies to achieve the maximum hurdle. Beginning with PSUs granted in 2013, the Committee broadened the range of potential award payouts to match those of annual incentive compensation awards. For PSUs granted in 2015,2016, achievement of threshold, target and maximum performance hurdles earns award payouts of 30 percent, 100 percent and 200 percent, respectively, of target. Over time, the Committee intends that the expanded range will result in delivery of a higher proportion of compensation through long-term performance-based compensation awards.–- 200%)20152016 is the three calendar years ending December 31, 2017.2018. The PSUs will vest and become payable on March 1, 2018,2019, if the company achieves one of the performance hurdles described in the preceding paragraph.2015,2016, was 69.07%,60.6 percent, exceeding that metric for fourfive of the 10nine companies in the peer group and earning payout at the thresholdtarget level of 30100 percent of the target number of shares.Performance
PeriodTarget PSUs
(#) Achievement
LevelPSUs Vested
(#)Value of PSUs
Vested
($)
(1)Steven J. Johnston 2013-2015 13,088 Threshold 3,927 232,361 2012-2014 13,472 Target 13,472 698,254 2011-2013 6,443 Maximum 8,054 421,788 Jacob F. Scherer, Jr. 2013-2015 8,998 Threshold 2,700 159,759 2012-2014 10,262 Target 10,262 531,879 2011-2013 4,799 Maximum 5,999 314,167 Michael J. Sewell 2013-2015 8,016 Threshold 2,405 142,304 2012-2014 9,578 Target 9,578 496,427 2011-2013 5,011 Maximum 6,264 328,046 Martin F. Hollenbeck 2013-2015 6,544 Threshold 1,964 116,210 2012-2014 7,731 Target 7,731 400,698 2011-2013 3,311 Maximum 4,139 216,759 Charles P. Stoneburner II 2013-2015 6,544 Threshold 1,964 116,210 2012-2014 7,526 Target 7,526 390,073 2011-2013 3,349 Maximum 4,187 219,273 Name Performance Period Target PSUs
(#) Achievement Level PSUs Vested
(#)Value of PSUs Vested
($)
(1) Steven J. Johnston 2014-2016 12,873 Target 12,873 975,130 2013-2015 13,088 Threshold 3,927 232,361 2012-2014 13,472 Target 13,472 698,254 Jacob F. Scherer, Jr. 2014-2016 8,850 Target 8,850 670,388 2013-2015 8,998 Threshold 2,700 159,759 2012-2014 10,262 Target 10,262 531,879 Michael J. Sewell 2014-2016 7,885 Target 7,885 597,289 2013-2015 8,016 Threshold 2,405 142,304 2012-2014 9,578 Target 9,578 496,427 Martin F. Hollenbeck 2014-2016 6,468 Target 6,468 489,951 2013-2015 6,544 Threshold 1,964 116,210 2012-2014 7,731 Target 7,731 400,698 Charles P. Stoneburner II 2014-2016 6,468 Target 6,468 489,951 2013-2015 6,544 Threshold 1,964 116,210 2012-2014 7,526 Target 7,526 390,073 (1) Based on the closing price on Nasdaq as of the last trading day of the performance period as follows: $59.17 for the performance period ending December 31, 2015$51.83 for the performance period ending December 31, 2014$52.37 for the performance period ending December 31, 2013Page 49full-timefull‑time associate in good standing for each year of service, up to a maximum of 10 shares. This plan, in effect since 1976, encourages stock ownership at all levels of the company. – - All of our officers and directors and certain associates identified by management as having regular access to potentially material, nonpublic information are prohibited from engaging in any form of hedging or monetization transactions involving the company’s stock. Such transactions can decouple the officer’s or director’s interest from the interests of shareholders generally and can limit the officer’s or director’s ability to control the timing of stock transactions to avoid times when in possession of material nonpublic information. – - We enjoy a strong culture of ownership, linking the long-term financial prospects for our associates to the long-term financial prospects for our shareholders generally through broad-based grants of equity compensation awards. Some of our associates, including some executive officers, choose to build their ownership in the company by pledging shares they own to collateralize loans from banks or brokers to exercise employee stock options. Some directors, officers and associates choose to hold their shares of stock in street name in accounts with banks or brokers as a matter of convenience. Depending on individual circumstances and decisions, these accounts can be subject to margin or collateral requirements.2015,2016, the level of shares pledged by our directors and executive officers as a group remained about the same as 20142015 levels.1617 of our 28current 27 directors and executive officers, do not pledge any shares. Another group of 10eight have pledged shares totaling less than 0.3 percent of the shares outstanding. The remaining two directors with pledged shares are members of one of the company’s founding families, with reported holdings of company stock that sufficiently outnumber the approximately 1.3 percent of shares outstanding that they hold in accounts and are available as collateral. Neither our chief executive officer nor our chief financial officer have pledged shares of company stock.TimingTiming.. Since 2010, the Committee established its February meeting as the date for granting stock-based compensation to company associates each year. This meeting is purposely scheduled to occur shortly after the company announces its financial results for the preceding quarter and year, and therefore occurs when it does not expect to be in possession of material nonpublic information. The Committee makes its grants of restricted stock to directors under the Directors’ Stock Plan of 2009 at its first regularly scheduled meeting of the year. The Committee believes the consistency of this practice since adoption of the first Director Stock Plan in 2003these practices eliminates concerns over timing. When grants are made at any other time of the year, the Committee ensures that such grants are grantedmade outside of any regular trading blackout associated with the company’s disclosure of financial results and when the company is not otherwise in possession of material nonpublic information.PricePrice.. All stock-based compensation is granted at fair market value on the date of grant. ForUnder all stock-based awards since 2007 under the 2012 Stock Compensation Plan and the 2006 Stock Compensation Plan,compensation plans, fair market value is defined as the average of the high and low sale price on Nasdaq on the grant date. Unless a future date is specified, the grant date is the date of the Committee meeting at which the grant is made. Fair market value for awards under the 2009 Director Stock Plan and the Holiday Stock Plan is the average of the high and low sale pricePage 50on Nasdaq on the grant date. The Committee does not delegate timing or pricing of these stock-based awards to management.2015,2016, Messrs. Scherer and Stoneburner were participants in The Cincinnati Financial Corporation Retirement Plan (Retirement Plan), our tax-qualified defined benefit pension plan. There are no special or enhanced pension formulas for the named executive officers, compared with other plan participants. The plan was frozen and closed to new participants in mid-2008.20152016 Pension Benefits table and the discussion following, beginning on Page 60.20152016 was $265,000.20152016 Nonqualified Deferred Compensation table and the discussion following, beginning on Page 62.to buildwith building savings for retirement by providing a company match of associate contributions to a tax-qualified 401(k) plan. This change was primarily in response to requests from associates who wanted control over their retirement benefit accounts. Participation in the defined benefit pension plan terminated for associates under the age of 40, and they transitioned to the new tax-qualified 401(k) plan with a company matching contribution. None of the named executive officers were under age 40 at the time of the transition. Associates age 40 and over as of August 31, 2008, were given a one-time election to remain in the defined benefit pension plan or to leave the plan and participate in the 401(k) plan with a company match. Those associates leaving the pension plan received distributions of their accumulated pension benefit from the defined benefit plan that they could choose to receive in cash, roll over to the company’s 401(k) plan or roll over to an Individual Retirement Account. Mr. Hollenbeck elected to leave the defined benefit plan in connection with the 2008 transition. Messrs. Johnston and Sewell, hired after entry to the pension plan was closed, also participate in the 401(k) plan with the company match. Messrs. Scherer and Stoneburner elected to remain in the pension plan.Page 51$12,629$17,987 for any named executive officer in 2015.How We Make Compensation Decisions·Its judgment about the effectiveness of the executive compensation program generally;·The effect of any changes to the program;·The result of the most recent shareholder advisory vote to approve executive compensation and feedback about the executive compensation program received from shareholders during annual outreach calls;·The compensation risk assessment conducted by the company’s chief risk officer;·Current and historical compensation and performance data supplied by the chief executive officer for each named executive officer, excluding himself;·Reports generated through Equilar on the amounts and components of compensation paid to the named executive officers of the companies in the peer group;·Each officer’s individual performance, experience, expertise and functional responsibilities; and·Company performance, both financial and nonfinancial.company.2015,2016, the Committee considered the annual compensation risk assessment conducted by the chief risk officer. For the executive compensation program, the risk assessment identified the component parts of the program and the information and process used by the committeeCommittee to set the level of compensation for each. Independence and qualifications of committee members and rigor of the committee’s oversight and administration of the executive compensation program also were examined.Page 522015annual compensation risk assessment.Base annual salary levels are modest.Performance objectives The two other performance objectives are publicly reported in the company's periodic reports. Achievement is determined by company performance, not individual performance. Annualsubject to clawback provisions.Performance objectives and targets are easily calculable and clearly disclosed to investors.capped. Robust processes require the Committee to certify performance and authorize payment.The Committee may exercise negative discretion to reduce or eliminate awards when appropriate.Robust processes require the Committee to certify performance achievement and authorize payment.We believe that it is important to link performance-based compensation to company performance compared with peers. Accordingly, the performance targets for our annual incentive compensation and PSUs are relative targets compared with our peer group. We also believe that linking the level of performance-based awards to a percentage of base annual salary that is paid out according to a predetermined formula based upon achievement of performance goals for all of our executive officers unites the personal financial interests of the executive team, focusing its attention on achievement of performance goals designed to increase shareholder value over the long term.We do not use the peer group to benchmark executive compensation. We use the peer group to compare our performance to those companies against whom we compete each day, irrespective of the size of any peer company. As reported by Equilar, total direct compensation of $26,990,615 paid to our named executive officers as a group in 2014, the last year for which peer data is available, was approximately 50 percent of the average total compensation of $53,181,623 paid by companies in the peer group to their named executive officers as a group in the same year. Page 53For similar reasons,do not benchmarkcompete each day, irrespective of the size of any peer company. We believe that it is important to link performance-based compensation to company performance compared with peers. Accordingly, the primary performance targets for our annual incentive compensation and PSUs are relative targets compared with our peer group. We also believe that linking the level of individual namedperformance-based awards to a percentage of base annual salary that is paid out according to a predetermined formula based upon achievement of performance goals for all of our executive officers with executives carrying similar titles across a peer group. unites the personal financial interests of the executive team, focusing its attention on achievement of performance goals designed to increase shareholder value over the long term.Since 2012, ourBecause one of the companies in the 10 member peer group has consisted of 10 publicly traded companies:used by the committee since 2012 was acquired by a non-U.S. insurer in early 2016, the Committee decreased the peer group to the remaining nine companies beginning with performance year 2016. The nine peer companies are:The Chubb Corporation10nine U.S.-domiciled companies were selected because they generally market their products through the same types of independent insurance agencies that represent our company, and they provide both commercial lines and personal lines of insurance, as we do. We also included companies in the peer group that historically have followed an equity investment strategy similar to ours, or that offer life insurance products or surplus lines coverages.10nine companies in the peer group according to market capitalization at December 31, 2015,2016, and ranks three-year value creation ratio, three-year total shareholder returns as of December 31, 2015,2016, as reported by Bloomberg LP, and compensation data compiled by Equilar from our peers’ 2015the 2016 proxy statements filed by the peer group, the most recent year for which such data is available.RankMarketCapitalizationRank Market
CapitalizationThree-Year
Value Creation RatioThree-Year
Total
Shareholder
ReturnTotal Direct
Compensation
(from 20152016 Proxy Statements)1 Travelers W.R. Berkley United Fire Travelers 2 Allstate Selective Selective W.R. Berkley 3 Hartford Cincinnati W.R. Berkley Hartford 4 Markel Travelers Hanover Allstate 5 Cincinnati United Fire Cincinnati Selective 6 W.R. Berkley Markel Markel Hanover 7 Hanover Hanover Travelers Markel 8 2ChubbCincinnatiHartfordW.R. Berkley3SelectiveAllstate SelectiveAllstateMarkelHartfordCincinnati 4HartfordChubb9United Fire AllstateState Auto5MarkelUnited FireChubbChubb6CincinnatiTravelersSelectiveMarkel7W.R. BerkleyW.R. BerkleyCincinnatiHanover8HanoverHartfordState Auto TravelersSelective9SelectiveHanoverAllstateCincinnati10 United FireAllstateW.R.BerkleyState Auto11State Auto Hartford State Auto United Fire arehistorically have been low compared with peers, in line with our tradition of keeping overall expenses low. Our compensation programs are not complex and, because we do not benchmark compensation to peers, the Committee does not believe it requires the services of a compensation consultant to assist with either administration of current plans or the determination of appropriate levels of compensation. The Committee will continue to monitor our compensation structure to ensure that the compensation it wishes to deliver to the executive team is delivered as appropriate, considering overall company and individual performance. The Committee does review and consider peer group performance and compensation data collected from the Equilar service and publicly available proxy statements and Form 10-K filings.compensation”.compensation.” The Committee intends for our annual incentive compensation awards and PSUs (which permit the Committee to exercise negativePage 54from time to timeoccasionally approve compensation for certain named executive officers that is not fully deductible and reserves the right to do so in the future, in appropriate circumstances.In 2015, nonperformance-based Moreover, despite the Committee's efforts to structure performance-based compensation for each of the named executive officers fell below the $1 millionin a manner intended to be exempt from Section 162(m) cap and is believedtherefore not subject to its deduction limits, because of ambiguities and uncertainties as to the application and interpretation of Section 162(m) and the regulations issued thereunder, no assurance can be fully deductible.15-member13-member group of executive officers, who average 2623 years with the company.trigger”,trigger,” which requires both a change in control event, as defined in the plans, and termination of the associate’s employment due to the change in control within a specified time period. The double trigger ensures that we will become obligated to accelerate vesting of prior awards only if the associate is actually or constructively discharged because of the change in control event.2015,2016, we paid $34,036$12,398 for executive communicationaccounting and financial reporting consulting services to a retired executive officer.Page 55Name and Principal Position Year Salary
($)Bonus
($)
(1)Stock
Awards
($)
(2) (4)Option
Awards
($)
(3)Nonequity
Incentive
Plan
Compen-
sation
($)Change in Pension
Value and
Nonqualified
Deferred
Compensation
Earnings
($)
(5)All Other
Compensation
($)
(8)(9)Total
Compensation
($) Steven J. Johnston 2015 941,975 - 665,213 151,834 283,662 - 121,300 2,163,984 Chief Executive Officer 2014 922,846 - 473,132 131,132 927,000 - 169,697 0 2,623,807 and President 2013 884,615 - 586,858 126,852 1,800,000 - 103,632 0 3,501,957 Cincinnati Financial Corporation Jacob F. Scherer, Jr. 2015 863,477 - 410,863 90,465 169,015 721,831 (6) 13,842 2,269,493 Chief Insurance Officer and 2014 845,942 - 325,573 90,151 552,338 766,538 (6) 24,761 2,605,303 Executive Vice President 2013 813,462 - 403,799 87,210 1,072,500 576,577 (6) 17,882 2,971,429 The Cincinnati Insurance Company Michael J. Sewell 2015 769,279 - 365,735 80,599 150,577 - 86,508 1,452,698 Chief Financial Officer, 2014 753,658 - 289,770 80,321 492,083 - 113,129 1,728,961 Senior Vice President and Treasurer Cincinnati Financial Corporation 2013 729,615 - 400,591 77,693 955,500 - 83,302 2,246,701 Martin F. Hollenbeck 2015 633,539 - 301,914 66,437 124,122 - 71,004 1,197,016 Chief Investment Officer and Senior Vice President Cincinnati Financial Corporation Charles P. Stoneburner II 2015 633,539 - 301,914 66,437 124,122 607,422 (7) 9,175 1,742,609 Senior Vice President 2014 617,769 - 238,082 65,887 403,650 635,249 (7) 14,064 1,974,701 The Cincinnati Insurance Company 2013 592,308 - 293,810 63,426 780,000 288,465 (7) 9,124 2,027,133 Name and Principal Position Year Salary
($)Bonus
($)
(1)Stock Awards
($)
(2)(4)Option
Awards
($)
(3)Non-
equity Incentive Plan Compen-
sation
($)Change in Pension Value and
Nonqualified Deferred Compen-
sation Earnings
($)
(5)All Other Compen-
sation
($)
(8)(9)Total Compen-
sation
($)
Chief Executive Officer
and President
Cincinnati Financial Corporation2016 960,814 — 917,696 155,459 2,121,792 — 94,142 4,249,903 2015 941,975 — 665,213 151,834 283,662 — 121,300 — 2,163,984 2014 922,846 — 473,132 131,132 927,000 — 169,697 — 2,623,807
Chief Insurance Officer and
Executive Vice President
The Cincinnati Insurance
Company2016 887,747 — 581,968 93,542 1,160,572 575,137 (6 ) 19,200 3,318,166 2015 863,477 — 410,863 90,465 169,015 721,831 (6 ) 13,842 2,269,493 2014 845,942 — 325,573 90,151 552,338 766,538 (6 ) 24,761 2,605,303
Chief Financial Officer,
Senior Vice President
and Treasurer
Cincinnati Financial Corporation2016 784,665 — 513,159 82,525 1,023,925 — 71,520 2,475,794 2015 769,279 — 365,735 80,599 150,577 — 86,508 1,452,698 2014 753,658 — 289,770 80,321 492,083 — 113,129 1,728,961
Chief Investment Officer and
Senior Vice President
Cincinnati Financial Corporation2016 646,808 — 423,473 68,033 844,032 — 59,884 2,042,230 2015 633,539 — 301,914 66,437 124,122 — 71,004 1,197,016 2014 617,769 — 238,082 65,887 403,650 — 95,751 1,421,139
Senior Vice President
The Cincinnati Insurance
Company2016 657,090 — 431,722 69,367 860,582 444,699 (7 ) 13,533 2,476,993 2015 633,539 — 301,914 66,437 124,122 607,422 (7 ) 9,175 1,742,609 2014 617,769 — 238,082 65,887 403,650 635,249 (7 ) 14,064 1,974,701 (1) Since 2010, the Committee has eliminated discretionary cash bonuses as a regular component of compensation for the named executive officers. (2) Amounts shown in the Stock Awards column reflect values for grants of PSUs, RSUs and Holiday Stock awards. PSUs are intended to be performance-based compensation for purposes of Section 162(m) and reflect the full grant date fair values in accordance with FASB ASC 718. Amounts for PSUs are computed using a Monte Carlo valuation on the date of grant. Amounts for RSUs reflect the full grant date fair value in accordance with FASB ASC 718. These amounts do not represent the actual value that may be realized by the named executive officers. For assumptions used in determining the values for awards of PSUs and RSUs, see our 20152016 Annual Report on Form 10-K, Part II, Item 8, Note 17, Page 152.160. Awards under the Holiday Stock Plan are valued at fair market value on the date of grant. The per share fair market values were $71.55, $59.81 $51.20 and $50.84$51.20 for the grant dates of November 11, 2016, November 13, 2015 and November 14, 2014, and November 15, 2013, respectively. There were no forfeitures of Holiday Stock or PSU or RSU awards by the named executive officers in 2016, 2015 2014 or 2013.2014.(3) Amounts in the Option Awards column reflect the value of awards for grants of nonqualified stock options. These nonqualified stock options are intended to be performance-based compensation for purposes of Section 162(m) and reflect the full grant date fair values in accordance with FASB ASC 718. These amounts do not represent the actual value, if any, that may be realized by the named executive officers. For assumptions used in calculation of option awards, see our 20152016 Annual Report on Form 10-K, Part II, Item 8, Note 17, Page 152.160. There were no forfeitures of option awards by the named executive officers in 2016, 2015 2014 or 2013.2014.(4) Maximum values of PSUs granted in 20152016 are: $1,241,387$1,652,933 for Mr. Johnston; $739,637$994,597 for Mr. Scherer; $658,969$877,453 for Mr. Sewell, and $543,181 each$723,369 for Messrs.Mr. Hollenbeck and $737,555 for Mr. Stoneburner.Maximum values of PSUs granted in 2014 are: $945,651 for Mr. Johnston; $650,121 for Mr. Scherer; $579,232 for Mr. Sewell and $475,139 each for Messrs. Hollenbeck and Stoneburner.Maximum values of PSUs granted in 2013 are: $1,173,208 for Mr. Johnston; $806,581 for Mr. Scherer; $718,554 for Mr. Sewell; and $586,604 each for Messrs. Hollenbeck and Stoneburner.(5) No above-market or preferential earnings were paid on deferred compensation. The amounts shown in this column represent the aggregate change in actuarial present value of accumulated pension benefits for those named executive officers participating in the company’s Retirement Plan and SERP for each of the years presented, using the same pension plan measurement date and assumptions used for financial reporting purposes. In addition to one year of service credit under the Retirement Plan and the SERP for Messrs. Scherer and Stoneburner, the changes in plan balances are primarily due to fluctuations in the applicable interest rate and discount rate used to actuarially calculate the accumulated benefit in each plan.(6) For Mr. Scherer, in 2016 an increase of $169,439 in the Retirement Plan and an increase of $405,698 in the SERP; in 2015 an increase of $145,399 in the Retirement Plan and an increase of $576,432 in the SERP. InSERP; and in 2014 an increase of $206,948 in the Retirement Plan and an increase of $559,590 in the SERP as the company adjusted the lump sum factor in the calculation to reflect a projected rate at normal age of retirement and applied a discount rate to more fully capture all assumptions used in the company’s GAAP financial statements. In 2013,(7) For Mr. Stoneburner, in 2016 an increase of $129,381$165,781 in the Retirement Plan and an increase of $447,196$278,918 in the SERP. Had the discount rate and adjusted lump sum factor been applied to the calculations for 2013, the aggregate change in actuarial present value of accumulated retirement benefits for Mr. Scherer would have produced an increase in the Retirement Plan of $15,962 and an increase in the SERP of $204,237.(7)For Mr. Stoneburner,SERP; in 2015 an increase of $156,971 in the Retirement Plan and an increase of $450,451 in the SERP; and in 2014 an increase of $226,921 in the Retirement Plan and an increase of $408,328 in the SERP; and in 2013, an increase of $61,612 in the Retirement Plan and an increase of $226,853 in the SERP.(8)For Messrs. Johnston, Sewell, Hollenbeck and Stoneburner, includes perquisites in an aggregate amount less than $10,000 for one or more of the types described in Perquisites and Other Personal Benefits, Page 52.(8) For Mr. Scherer,Johnston, includes perquisites in the amount of $12,629,$17,099, which includes the incremental additional cost of $2,971$13,573 for spouse travel and meals for business events to which spouses are invited, club dues of $6,670, premiums paid for a personalPage 56umbrella liability insurance policy, in the amount of $1,861, executive tax services,club dues, personal use of a company car, a safe driver award and an executive health examination.(9) Includes matching contributions to the company’s 401(k) and Top Hat Savings Plans in the amounts of $112,139$74,669 for Mr. Johnston, $75,682$56,115 for Mr. Sewell and $62,231$46,256 for Mr. Hollenbeck.2015Name Grant Date Estimated Possible Payouts
Under Nonequity Incentive Plan
Awards
Estimated Possible Payouts
Under Equity Incentive Plan
Awards
All
Other
Stock
Awards:
Number
of Shares
of Stock
or Units
(2)All Other
Option
Awards:
Number of
Securities
Under-
lying
OptionsExercise
or Base
Price of
Option
AwardsGrant
Date Fair
Value of
Stock and
Option
Awards Threshold
($) Target
($) Maximum
($)Threshold
(#) Target
(#) Maximum
(#)(#) (#) ($/Sh) ($) Steven J. Johnston 2/13/2015 ** 13,573 52.25 151,834 2/13/2015 * 283,662 945,540 1,891,080 2/13/2015 ** 4,072 13,573 27,146 620,693 2/13/2015 ** 905 44,101 11/13/2015 *** 7 419 Jacob F. Scherer, Jr. 2/13/2015 ** 8,087 52.25 90,465 2/13/2015 * 169,015 563,384 1,126,768 2/13/2015 ** 2,427 8,087 16,174 369,819 2/13/2015 ** 830 40,446 11/13/2015 *** 10 598 Michael J. Sewell 2/13/2015 ** 7,205 52.25 80,599 2/13/2015 * 150,577 501,924 1,003,848 2/13/2015 ** 2,162 7,205 14,410 329,485 2/13/2015 ** 739 36,011 11/13/2015 *** 4 239 Martin F. Hollenbeck 2/13/2015 ** 5,939 52.25 66,437 2/13/2015 * 124,122 413,741 827,482 2/13/2015 ** 1,782 5,939 11,878 271,590 2/13/2015 ** 610 29,725 11/13/2015 *** 10 598 Charles P. Stoneburner II 2/13/2015 ** 5,939 52.25 66,437 2/13/2015 * 124,122 413,741 827,482 2/13/2015 ** 1,782 5,939 11,878 271,590 2/13/2015 ** 610 29,725 11/13/2015 *** 10 598 Name Grant Date Estimated Possible Payouts Under Nonequity Incentive Plan Awards Estimated Possible Payouts Under Equity Incentive Plan Awards All Other Stock Awards:
Number of Shares of Stock or Units
(2)All Other Option Awards: Number of Securities Under-lying Options Exercise or Base Price of Option Awards Grant Date Fair Value of Stock and Option Awards Threshold
($) Target
($) Maximum ($) Threshold
(#) Target
(#) Maximum
(#)(#) (#) ($/Sh) ($) Mr. Johnston 2/12/2016 ** 11,768 61.47 155,459 2/12/2016 * 318,269 1,060,896 2,121,792 2/12/2016 ** 3,531 11,768 23,536 826,467 2/12/2016 ** 1,569 90,657 11/11/2016 *** 8 572 Mr. Scherer 2/12/2016 ** 7,081 61.47 93,542 2/12/2016 * 174,086 580,286 1,160,572 2/12/2016 ** 2,125 7,081 14,162 497,299 2/12/2016 ** 1,453 83,954 11/11/2016 *** 10 715 Mr. Sewell 2/12/2016 ** 6,247 61.47 82,525 2/12/2016 * 153,589 511,963 1,023,925 2/12/2016 ** 1,875 6,247 12,494 438,727 2/12/2016 ** 1,282 74,074 11/11/2016 *** 5 358 Mr. Hollenbeck 2/12/2016 ** 5,150 61.47 68,033 2/12/2016 * 126,605 422,016 844,032 2/12/2016 ** 1,545 5,150 10,300 361,685 2/12/2016 ** 1,057 61,073 11/11/2016 *** 10 715 Mr. Stoneburner 2/12/2016 ** 5,251 61.47 69,367 2/12/2016 * 129,087 430,291 860,582 2/12/2016 ** 1,576 5,251 10,502 368,778 2/12/2016 ** 1,077 62,229 11/11/2016 *** 10 715 * Cincinnati Financial Corporation 2009 Incentive Compensation Plan ** Cincinnati Financial Corporation 2012 Stock Compensation Plan *** Holiday Stock Plan. See Long-Term Stock-Based Compensation, Page 47,49, for information about awards of shares under the Holiday Stock Plan.(1) No material modifications or repricing occurred with respect to any outstanding option or other stock-based award in 2015.2016.(2) The grant date fair value of shares awarded under the Holiday Stock Plan is 100 percent of the average of the high and low sales price on Nasdaq on the date of grant, which was $59.81$71.55 on November 13, 2015.11, 2016.compensation received for 2014.Total compensation for 2014 shown in the Summary Compensation Table, excluding attributions of compensation related to retirement plans, generally decreased from 2013 levels because of a lower grant date fair value per share for stock-based compensation and achievement of target payouts of annual incentive compensation awards, rather than maximum payouts of annual incentive compensation received for 2013.Page 57In February 2013, the Committee adjusted base annual salaries to $900,000 for Mr. Johnston; to $825,000 for Mr. Scherer; to $735,000 for Mr. Sewell; to $600,000 for Mr. Hollenbeck and to $600,000 for Mr. Stoneburner.51.Page 5820152016 Year End Option Awards (1) Stock Awards Name Number of
Securities
Underlying
Unexercised
Options
Exercisable
(#)Number of
Securities
Underlying
Unexercised
Options
Unexercisable
(#)Equity
Incentive Plan
Awards:
Number of
Securities
Underlying
Unexercised
Unearned
Options
(#)Option
Exercise
Price
($)Option
Expiration
DateNumber
of Shares
or Units
of Stock
That
Have Not
Vested
(#)
(2) Market Value
of Shares or
Units of Stock
That Have Not
Vested
($)Equity
Incentive
Plan
Awards:
Number of
Unearned
Shares,
Units or
Other
Rights
That Have
Not Vested
(#)
(2)(3)
Plan Awards:
Market or
Payout Value of
Unearned Shares,
Rights That Have
Not Vested
($)Steven J. Johnston 8,000 26.59 11/14/2018 10,234 26.58 2/19/2020 7,991 34.04 2/18/2021 4,893 31.62 5/2/2021 13,472 35.63 2/17/2022 8,725 4,363 44.70 2/15/2023 13,088 780,830 4,291 8,582 46.81 2/14/2024 12,873 768,003 13,573 52.25 2/13/2025 13,573 809,765 905 53,992 Jacob F. Scherer, Jr. 7,500 44.79 1/31/2017 8,000 37.59 2/18/2018 8,933 34.04 2/18/2021 664 31.62 5/2/2021 10,262 35.63 2/17/2022 5,999 2,999 44.70 2/15/2023 8,998 536,821 2,950 5,900 46.81 2/14/2024 8,850 527,991 8,087 52.25 2/13/2025 8,087 482,470 830 49,518 Michael J. Sewell 10,021 30.27 5/31/2021 9,578 35.63 2/17/2022 1,028 61,330 5,344 2,672 44.70 2/15/2023 8,016 478,235 2,629 5,256 46.81 2/14/2024 7,885 470,419 7,205 52.25 2/13/2025 7,205 429,850 739 44,089 Martin F. Hollenbeck 2,000 44.79 1/31/2017 2,250 37.59 2/18/2018 6,621 34.04 2/18/2021 7,731 35.63 2/17/2022 4,363 2,181 44.70 2/15/2023 6,544 390,415 2,156 4,312 46.81 2/14/2024 6,468 385,881 5,939 52.25 2/13/2025 5,939 354,321 610 36,393 Charles P. Stoneburner II 2,000 44.79 1/31/2017 8,577 26.58 2/19/2020 6,698 34.04 2/18/2021 7,526 35.63 2/17/2022 4,363 2,181 44.70 2/15/2023 6,544 390,415 2,156 4,312 46.81 2/14/2024 6,468 385,881 5,939 52.25 2/13/2025 5,939 354,321 610 36,393 Option Awards (1) Stock Awards Name Number of Securities Underlying Unexercised Options Exercisable
(#)Number of Securities Underlying Unexercised Options Unexercis-
able
(#)Equity Incentive Plan Awards: Number of Securities Underlying Unexercised Unearned Options
(#)Option Exercise Price
($)Option Expiration Date Number of Shares or Units of Stock That Have Not Vested
(#)
(3) Market Value of Shares or Units of Stock That Have Not Vested
($)Equity Incentive Plan Awards: Number of Unearned Shares, Units or Other Rights That Have Not Vested
(#)
(2)(3)(4)Equity Incentive Plan Awards: Market or Payout Value of Unearned Shares, Units or Other Rights That Have Not Vested
($)Mr. Johnston 10,234 26.58 2/19/2020 7,991 34.04 2/18/2021 4,893 31.62 5/2/2021 13,472 35.63 2/17/2022 13,088 44.70 2/15/2023 12,873 975,258 8,582 4,291 46.81 2/14/2024 13,573 1,028,290 4,525 9,048 52.25 2/13/2025 603 45,683 11,768 891,544 — 11,768 61.47 2/12/2026 1,569 118,867 Mr. Scherer 8,000 37.59 2/18/2018 8,933 34.04 2/18/2021 664 31.62 5/2/2021 10,262 35.63 2/17/2022 8,998 44.70 2/15/2023 8,850 670,476 5,900 2,950 46.81 2/14/2024 8,087 612,671 2,696 5,391 52.25 2/13/2025 553 41,895 7,081 536,457 7,081 61.47 2/12/2026 1,453 110,079 Mr. Sewell 9,578 35.63 2/17/2022 8,016 44.70 2/15/2023 7,885 597,368 5,257 2,628 46.81 2/14/2024 7,205 545,851 2,402 4,803 52.25 2/13/2025 492 37,274 6,247 473,273 — 6,247 61.47 2/12/2026 1,282 97,124 Option Awards (1) Stock Awards Name Number of Securities Underlying Unexercised Options Exercisable
(#)Number of Securities Underlying Unexercised Options Unexercis-
able
(#)Equity Incentive Plan Awards: Number of Securities Underlying Unexercised Unearned Options
(#)Option Exercise Price
($)Option Expiration Date Number of Shares or Units of Stock That Have Not Vested
(#)
(3) Market Value of Shares or Units of Stock That Have Not Vested
($)Equity Incentive Plan Awards: Number of Unearned Shares, Units or Other Rights That Have Not Vested
(#)
(2)(3)(4)Equity Incentive Plan Awards: Market or Payout Value of Unearned Shares, Units or Other Rights That Have Not Vested
($)Mr. Hollenbeck 6,621 34.04 2/18/2021 7,731 35.63 2/17/2022 6,544 44.70 2/15/2023 6,468 490,016 4,312 2,156 46.81 2/14/2024 5,939 449,939 1,980 3,959 52.25 2/13/2025 406 30,759 5,150 390,164 — 5,150 61.47 2/12/2026 1,057 80,078 Mr. Stoneburner 8,577 26.58 2/19/2020 6,698 34.04 2/18/2021 7,526 35.63 2/17/2022 6,544 — 44.70 2/15/2023 4,312 2,156 46.81 2/14/2024 6,468 490,016 1,980 3,959 52.25 2/13/2025 5,939 449,939 406 30,759 — 5,251 61.47 2/12/2026 5,251 397,816 1,077 81,594 (1) One-third of each option award vests and becomes exercisable on the first, second and third anniversaries of the grant, provided the associate remains continuously employed with the company or its subsidiaries. The vesting date of each option is listed in the table below: Page 59Grant DateVesting DatesExpiration Date1/31/20071/31/20081/31/20091/31/20101/31/2017Grant Date Vesting Dates Expiration Date 2/18/2008 2/18/2009 2/18/2010 2/18/2011 2/18/2018 7/1/2008 7/1/2009 7/1/2010 7/1/2011 7/1/2018 11/14/2008 11/14/2009 11/14/2010 11/14/2011 11/14/2018 2/19/2010 2/19/2011 2/19/2012 2/19/2013 2/19/2020 2/18/2011 2/18/ /20122/18/ /20132/18/ /20142/18/ /20215/2/2011 5/2/2012 5/2/2013 5/2/2014 5/2/2021 5/31/2011 5/31/2012 5/31/2013 5/31/2014 5/31/2021 2/17/2012 2/17/2013 2/17/2014 2/17/2015 2/17/2022 2/15/2013 2/15/2014 2/15/2015 2/15/2016 2/15/2023 2/14/2014 2/14/2015 2/14/2016 2/14/2017 2/14/2024 2/13/2015 2/13/2016 2/13/2017 2/13/2018 2/13/2025 2/12/2016 2/12/2017 2/12/2018 2/12/2019 2/12/2026 (2) PSUs granted on February 14, 2014, will vestvested on March 1, 2017, ifat the target payout level based upon the achievement company-level performance targets are achieved.objectives.(3) One-third of the RSUs granted on February 13, 2015, vested on March 1, 2016.2016, another one-third vested on March 1, 2017, and the final one-third is scheduled to vest on March 1, 2018. PSUs granted on February 13, 2015, will vest on March 1, 2018, if the company-level performance targets are achieved.2015(4) One-third of the RSUs granted on February 12, 2016, vested on March 1, 2017, another one-third is scheduled to vest on March 1, 2018, and the final one-third is scheduled to vest on March 1, 2019. PSUs granted on February 12, 2016, will vest on March 1, 2019, if the company-level performance targets are achieved. Option Awards Stock Awards Name Number of Shares
Acquired on Exercise
(#)Value Realized on
Exercise
($)Number of Shares
Acquired on Vesting
(#)Value Realized on
Vesting
($) Steven J. Johnston - - 13,472 710,379 Jacob F. Scherer, Jr. 15,000 231,150 10,262 541,115 Michael J. Sewell - - 9,578 505,048 Martin F. Hollenbeck 4,000 37,560 7,731 407,656 Charles P. Stoneburner II 4,000 63,880 7,526 396,846 2015Option Awards Stock Awards Name Number of Shares Acquired on Exercise
(#)Value Realized on Exercise
($)Number of Shares Acquired on Vesting
(#)Value Realized on Vesting
($)Mr. Johnston 8,000 359,920 4,229 269,472 Mr. Scherer 7,500 241,575 2,977 189,694 Mr. Sewell 10,021 384,506 3,680 232,670 Mr. Hollenbeck 4,250 119,330 2,168 138,145 Mr. Stoneburner 2,000 55,200 2,168 138,145 Name Plan Name Number of Years
Credited Service
(#)Present Value of
Accumulated Benefit
($) (1)Steven J. Johnston (2) Qualified Pension Plan n/a - Supplemental Retirement Plan n/a - Jacob F. Scherer, Jr. (3) Qualified Pension Plan 32 1,171,207 Supplemental Retirement Plan 32 2,457,520 Michael J. Sewell (2) Qualified Pension Plan n/a - Supplemental Retirement Plan n/a - Martin F. Hollenbeck (2) Qualified Pension Plan n/a - Supplemental Retirement Plan n/a - Charles P. Stoneburner II (3) Qualified Pension Plan 35 1,298,900 Supplemental Retirement Plan 35 1,630,271 Name Plan Name Number of Years
Credited Service
(#)Present Value of
Accumulated Benefit
($) (1)Mr. Johnston (2) Qualified Pension Plan n/a — Supplemental Retirement Plan n/a — Mr. Scherer (3) Qualified Pension Plan 33 1,340,646 Supplemental Retirement Plan 33 2,863,218 Mr. Sewell (2) Qualified Pension Plan n/a — Supplemental Retirement Plan n/a — Mr. Hollenbeck (2) Qualified Pension Plan n/a — Supplemental Retirement Plan n/a — Mr. Stoneburner (3) Qualified Pension Plan 36 1,464,681 Supplemental Retirement Plan 36 1,909,189 (1) Amounts listed in the “Present Value of Accumulated Benefit” column were calculated as of December 31, 2015,2016, using the same actuarial assumptions used by the company for GAAP financial reporting purposes and assuming that benefits commence at age 65. The assumptions include a lump-sum factor of 1.51.25 percent for both plans and a discount rate of 4.554.30 percent in the Qualified Pension Plan and 4.304.10 percent in the Supplemental Retirement Plan.(2) Messrs. Johnston and Sewell joined the company after entry into the qualified pension plan was closed. Mr. Hollenbeck elected to leave the retirement plans in 2008 in connection with changes to the plans. (3) At December 31, 2015,2016, Messrs. Scherer and Stoneburner had reached the early retirement age under both plans.planplan.. The Cincinnati Financial Corporation Retirement Plan (Retirement Plan) is a tax-qualified defined benefit pension plan available to all full-time associates ages 40 and over on August 31, 2008, who elected to remain in the plan effective September 1, 2008. Members who were actively employed by the company on June 30, 2008, became fully vested in their accrued benefit. The Retirement Plan is closed to new members. Members of the Retirement Plan earn one year of service for each calendar year in which they work at least 1,000 hours. Members also earn service for time that they are paid, or entitled to be paid, but do not actually work. These times include vacation, holidays, illness, military duty and some periods of disability. Generally, the maximum amount of service that may be earned under the Retirement Plan is 40 years. The only exception is that 50 years of service may be earned by members who were employees of our former subsidiary, Inter-Ocean Insurance Company on or before February 23, 1973. There are no deductions for Social Security or other offset amounts.Page 601. 0.45 percent of the member’s average monthly earnings plus 1.35 percent of the member’s average monthly earnings up to $2,916.67; multiplied by years of service up to 15 years, plus 2. 0.6 percent of the members’member's average monthly earnings plus 1.8 percent of the member’s average monthly earnings up to $2,916.67; multiplied by years of service between 16 and 40.1. 0.9 percent of the member’s final average earnings; multiplied by years of service up to 15 years, plus 2. 1.2 percent of the member’s final average earnings; multiplied by years of service between 16 and 40. ·Single life only·Single life only with 60-month or 120-month guarantee·Joint and 50 percent contingent annuity·Joint and 66.67 percent contingent annuity·Joint and 75 percent contingent annuity·Joint and 100 percent contingent annuity·Lump sumPage 612015Name Aggregate Balance
at 2014 Year-EndExecutive
Contributions in
2015Registrant
Contributions in
2015Aggregate
Earnings in 2015Aggregate Balance
at 2015 Year-End ($) ($) (3) ($) (4) ($) ($) (5) Steven J. Johnston 3,630,059 103,582 96,239 725,494 4,555,374 Jacob F. Scherer, Jr. 1,348,393 431,739 - (60,757) 1,719,375 Michael J. Sewell 1,138,458 322,945 59,782 143,552 1,664,737 Martin F. Hollenbeck 721,830 46,331 46,331 35,147 849,639 Charles P. Stoneburner II 248 - - 8 256 Name Aggregate Balance at 2015 Year-End Executive Contributions in 2016 Registrant Contributions in 2016 Aggregate Earnings in 2016 Aggregate Balance at 2016 Year-End ($) ($) (3) ($) (4) ($) (6) ($) (5) Mr. Johnston 4,555,374 74,669 58,769 1,458,439 6,147,250 Mr. Scherer 1,719,375 — — 173,106 1,892,481 Mr. Sewell 1,664,737 67,462 40,215 260,799 2,033,212 Mr. Hollenbeck 849,639 30,356 30,356 127,477 1,037,827 Mr. Stoneburner 256 — — 10 266 (1) Prior to 2009 the company did not contribute to the Top Hat Savings Plan. (2) No withdrawals or distributions occurred in 2015.2016.(3) The named executive officers’ contributions shown in this column are also reported in the Summary Compensation Table in the salary column, and included in the amounts shown for total compensation. (4) The amounts shown in this column reflect the company’s match of the eligible named executive officer’s contributions, up to 6 percent of the portion of their cash compensation that exceeds $260,000.$265,000.(5) Of the amounts shown in this column, $2,706,343;$2,781,012; $675,084; $871,370; $191,855$938,832; $222,211 and $0 for Messrs. Johnston, Scherer, Sewell, Hollenbeck and Stoneburner respectively, were reported in the Summary Compensation Table in prior years.(6) Aggregate earnings in 2016 for Messrs. Johnston, Sewell and Hollenbeck were benefitted by significant investment allocations of their plan balances and contributions to the company's stock which delivered total shareholder return of 31.5 percent for the year ended December 31, 2016. 20152016 was $265,000. Contributions made by associates immediately vest, while company matching contributions vest after three years of service. Messrs. Johnston, Sewell and Hollenbeck participate in these defined contribution plans and receive company matches of contributions made in each up to the 6 percent maximum. Messrs. Scherer and Stoneburner also participate in these plans, but they do not receive the company match because they are participants in the defined benefit Retirement Plan and SERP.Page 622015,2016, amounts the named executive officer would receive are governed by the terms of our qualified and nonqualified defined benefit and defined contribution plans, the 2006 and 2012 Stock Compensation Plansour various stock compensation plans and the 2009 Annual Incentive Compensation Plan. Generally, upon termination of employment for any reason, the named executive officer would be entitled to receive the balance of the Top Hat Savings Plan account disclosed in the Aggregated Balance at 20152016 Year-End column of the 20152016 Nonqualified Deferred Compensation Plan table. Additionally, individual named executive officers would be entitled to receive the amounts set forth in the table below, depending on age and the nature of the termination.Name Top Hat
Savings PlanRetirement
PlanSERP Stock-Based Awards Annual Incentive Compensation Retirement Retirement
with
DisabilityChange
in ControlRetirement Retirement
with
DisabilityChange
in Control ($) ($) ($) ($) ($) ($) ($) ($) ($) Steven J. Johnston (1) 4,555,374 - - - 3,756,000 3,756,000 - 945,540 945,540 Jacob F. Scherer, Jr. (2) 1,719,375 1,277,718 2,668,806 - 1,879,234 1,879,234 - 563,384 563,384 Michael J. Sewell (1) 1,664,737 - - - 1,735,044 1,735,044 - 501,924 501,924 Martin F. Hollenbeck (3) 849,639 - - - 1,373,158 1,373,158 - 413,741 413,741 Charles P. Stoneburner II (2) 256 1,416,588 1,769,888 1,066,066 1,373,158 1,373,158 124,122 413,741 413,741 Name Top Hat Savings Plan Retirement Plan SERP Stock-Based Awards Annual Incentive Compensation Retirement Retirement with Disability Change
in ControlRetirement Retirement with Disability Change
in Control ($) ($) ($) ($) ($) ($) ($) ($) ($) Mr. Johnston (1) 6,147,250 — — — 3,918,797 3,918,797 — 2,121,792 2,121,792 Mr. Scherer (2) 1,892,481 1,345,156 2,918,718 — 2,518,598 2,518,598 — 1,160,572 1,160,572 Mr. Sewell (1) 2,033,212 — — — 2,237,375 2,237,375 — 1,023,925 1,023,925 Mr. Hollenbeck (3) 1,037,827 — — — 1,841,057 1,841,057 — 844,032 844,032 Mr. Stoneburner (2) 266 1,486,338 1,933,958 1,739,328 1,851,665 1,851,665 860,582 860,582 860,582 (1) Messrs. Johnston and Sewell were hired after entry into the defined benefit pension plan was closed and, therefore, were never members of the pension plan or the SERP. If either retired due to a disability or terminated employment because of change of control, he would receive accelerated vesting of certain outstanding stock-based awards under the 2006 and 2012 Stock Compensation Plans, plus target levels of any outstanding annual incentive compensation award. (2) Messrs. Scherer and Stoneburner are eligible for early retirement under the defined benefit pension plan and SERP. If either retired due to a disability or terminated employment because of change of control, he would receive accelerated vesting at target levels of certain outstanding stock-based awards under the 2006 and 2012 Stock Compensation Plans and outstanding awards of annual incentive compensation under the 2009 Annual Incentive Plan. For any other termination of employment, Mr. Scherer would not receive accelerated vesting of such awards because he has not attained age 65 and has not beenPage 63employed with the company for 35 years. Because Mr. Stoneburner has been employed by the company for overmore than 35 years, for purposes of plan awards any other termination of employment would be treated as a retirement and Mr. Stoneburner would receive accelerated vesting of certain outstanding stock-based awards under the 2006 and 2012 Stock Compensation Plans and outstanding annual incentive compensation awards under the 2009 Annual Incentive Plan at levels determined by company performance. The amount shown for Mr. Stoneburner includes thresholdmaximum and target values of performanceannual incentive compensation and stock based awards, forrespectively, performance periods ending December 31, 2015,2016, and target levels for performance-based stock awards with performance periods ending after December 31, 2015.2016.(3) Mr. Hollenbeck elected to leave the defined benefit plan in 2008, in connection with the company’s restructuring of its retirement benefits. If he retired due to a disability or terminated employment because of change of control, he would receive accelerated vesting of certain outstanding stock-based awards under the 2006 and 2012 Stock Compensation Plans and outstanding annual incentive compensation awards at levels determined by company performance. For any other termination of employment, he would not receive accelerated vesting of such awards because he has not attained age 65 and has not been employed with the company for 35 years. 2015Name Fees Earned
or Paid in
Cash
($)Stock
Awards
($)
(3)(4)Option
Awards
($)
(5)Non-Equity
Incentive
Plan
Compen-
sation
($)Change in Pension
Value and Non-
qualified Deferred
Compensation
Earnings
($)
(6)All Other
Compensation
($)
(7)Total
($) William F. Bahl 159,000 100,021 - - - 6,119 265,140 Gregory T. Bier 109,000 100,021 - - - 4,620 213,641 Linda Clement-Holmes 70,000 70,009 - - - 1,380 141,389 Dirk J. Debbink 71,500 71,507 - - - 5,327 148,335 Kenneth C. Lichtendahl 70,000 70,009 - - - 1,539 141,548 W. Rodney McMullen 120,500 100,021 - - - 4,790 225,311 David P. Osborn 101,500 100,021 - - - 5,467 206,989 Gretchen W. Price 86,000 76,001 - - - 5,311 167,312 John J. Schiff, Jr. (2) - 598 - - 543,881 62,046 606,525 Thomas R. Schiff 97,000 97,026 - - - 4,046 198,072 Douglas S. Skidmore 70,000 70,009 - - - 5,332 145,341 Kenneth W. Stecher (2) - 315,981 70,855 132,376 1,060,724 559,118 2,139,054 John F. Steele, Jr. 86,500 86,541 - - - 5,058 178,099 Larry R. Webb 104,500 100,021 - - - 12,882 217,403 Name Fees Earned or Paid in Cash
($)Stock Awards
($)
(3)(4)Option Awards
($)
(5)Non-equity Incentive
Plan
Compen-
sation
($)Change in Pension Value and Non-qualified Deferred Compen-
sation Earnings
($)
(6)All Other Compen-
sation
($)
(7)Total
($) William F. Bahl 162,000 100,018 — — — 14,054 276,072 Gregory T. Bier 112,000 100,018 — — — 11,366 223,384 Linda Clement-Holmes 74,500 74,553 — — — 2,196 151,249 Dirk J. Debbink 76,000 76,042 — — — 12,195 164,237 Kenneth C. Lichtendahl 74,500 74,553 — — — 11,681 160,734 W. Rodney McMullen 123,500 100,018 — — — 12,195 235,713 David P. Osborn 104,500 100,018 — — — 12,074 216,592 Gretchen W. Price 92,000 82,001 — — — 1,066 175,067 John J. Schiff, Jr. (2) — 715 — — 79,235 41,285 121,235 Thomas R. Schiff 98,500 98,529 — — — 1,568 198,597 Douglas S. Skidmore 73,000 73,063 — — — 12,618 158,681 Kenneth W. Stecher (2) — 439,345 72,551 900,154 449,591 568,063 2,429,704 John F. Steele, Jr. 88,000 88,030 — — — 11,751 187,781 Larry R. Webb 107,500 100,018 — — — 19,919 227,437 (1) Mr. Johnston is a director and the chief executive officer and president of the company. Compensation for Mr. Johnston is shown in the Summary Compensation Table and supporting disclosure beginning on Page 56.60. Mr. Johnston receives no additional compensation for his service as a director.(2) Mr. J. Schiff, Jr. is a director and an employee of the company and until January 27, 2017, also is thewas a director and chairman of the executive Committees and an employeecommittees of the company’s insurance subsidiaries. Mr. Stecher is chairman of the board and until January 31, 2017, an executive officer of the company. In 2016, Messrs. Schiff and Stecher receivereceived no additional compensation for their service as directors.(3) Stock awards for nonemployee directors under the Directors Stock Plan of 2009 were valued at full fair market value determined by the average of the high and low sales price on Nasdaq on January 28, 2016,26, 2017, the date of grant, times the number of shares awarded. The per share fair market value on January 28, 2016,26, 2017, was $55.475.$70.94 . The number of shares granted to directors reported in this column were: 1,8031,410 to Mr. Bahl; 1,8031,410 to Mr. Bier; 1,2621,051 to Ms. Clement-Holmes; 1,2891,072 to Mr. Debbink; 1,2621,051 to Mr. Lichtendahl; 1,8031,410 to Mr. McMullen; 1,8031,410 to Mr. Osborn; 1,3701,156 to Ms. Price; 1,7491,389 to Mr. T. Schiff; 1,2621,030 to Mr. Skidmore; 1,5601,241 to Mr. SteeleSteele; and 1,8031,410 to Mr. Webb(4) The amount included in the Stock Awards column for Mr. Stecher reflects the value of PSUs, RSUs and Holiday Stock awards, if any. The amount shown for PSUs reflects the full grant date fair value in accordance with FASB ASC 718 using a Monte Carlo valuation on the date of grant. Amounts for RSUs reflect the full grant date fair value in accordance with FASB ASC 718. These amounts do not represent the actual value that may be realized by Mr. Stecher. For assumptions used in determining these values, see our 20152016 Annual Report on Form 10-K, Part II, Item 8, Note 17, Page 152.160. The maximum attainable value from the PSUs awarded to Mr. Stecher is $579,308.$771,406. Mr. J. Schiff, Jr. declined any award of RSUs or PSUs in 2015.2016. Awards under the Holiday Stock Plan are valued at full market value, determined by the average of the high and low sales price on Nasdaq on the date of grant, multiplied by the number of shares. On November 13, 2015,11, 2016, Messrs. J. Schiff, Jr. and Stecher were each granted 10 shares under this plan with a per share grant date fair market value of $59.81.$71.55. Nonemployee directors are not eligible to receive RSUs, PSUs or shares under the Holiday Stock Plan.(5) The amount in the Option Awards column reflects the value of grants of nonqualified stock options. The amount shown for nonqualified stock options reflects the full grant date fair value in accordance with FASB ASC 718. For assumptions used in calculation of option awards, see our 20152016 Annual Report on Form 10-K, Part II, Item 8, Note 17, Page 152.160. This amount does not represent the actual value, if any, that may be realized by Mr. Stecher. Mr. J. Schiff, Jr. declined any award of nonqualified stock options in 2015.2016. Nonemployee directors are not eligible to receive stock options under current company stock compensation plans.Page 64(6) No preferential earnings were paid on deferred compensation in 2015.2016. Amounts in this column reflect changes in values of the actuarially calculated accumulated benefit for Mr. Stecher in the Retirement Plan and for Messrs. Stecher and J. Schiff, Jr. in the company’s SERP. In 2015,2016, Mr. Stecher’s accumulated benefits in the Retirement Plan and SERP increased $308,267$143,487 and $752,457,$306,104, respectively. Mr. Schiff’s accumulated benefit in the SERP increased $543,881.$79,235.(7) For Mr. J. Schiff, Jr., includes salary of $55,769.$37,500.For Mr. Stecher, includes salary of $549,485.For Mdmes. Price and Clement-Holmes and Messrs. Bahl, Bier, Debbink, Lichtendahl, McMullen, Osborn, J. Schiff, Jr., T. Schiff, Skidmore, Stecher and Steele, amounts shown in this column reflect perquisites in an aggregate amount less than $10,000 for one or more of the types described in Perquisites and Other Personal Benefits, Page 52.For Mr. Webb, includes perquisites in an aggregate amount of $12,607, which amount includes the incremental additional cost of $3,063 for spouse travel and meals for business events to which spouses are invited and premiums of $9,544 paid for a personal umbrella liability insurance policy.2015,2016, nonemployee directors were compensated for their board service as follows:Annual Cash Retainer $40,000 Annual Stock Retainer $40,000 Lead Director Annual Cash Retainer $25,000 Independent Committee Chair Cash Retainer $10,000 Meeting Fees –- CashMeeting Fees –- StockMatches cash meeting fees up to maximum of $60,000 per year 50.53. Amounts shown in the Stock Awards column reflect grants awarded under the 2009 Stock Plan at the Committee’s meeting on January 28, 2016,26, 2017, for board service in 2015.52,54, for details about these benefits. Amounts contained in the All Other Compensation column reflect the aggregate cost of these individual benefits.Page 6520172018 Annual Meeting of Shareholders must submit the proposal to Cincinnati Financial Corporation, Attn: Lisa A. Love, Corporate Secretary, P.O. Box 145496, Cincinnati, Ohio 45250-5496, on or before November 18, 2016,16, 2017, to be included in our proxy statement for the 20172018 Annual Meeting of Shareholders. Any such proposal must conform to the rules and regulations of the SEC and otherwise be in accordance with other federal laws as well as the laws of the State of Ohio. If the date of the 20172018 Annual Meeting of Shareholders is not within 30 days of April 30, 2017,May 6, 2018, the deadline will be a reasonable time before we begin to print and mail the proxy materials for the 20172018 annual meeting. In addition, the proxy solicited by the board for the 20172018 annual meeting will confer discretionary authority on the persons named in such proxy to vote on any shareholder proposal presented at that meeting if we receive notice of such proposal later than February 1, 2017,January 31, 2018, without the matter having been discussed in such proxy.20172018 Annual Meeting of Shareholders (other than any proposal made pursuant to Rule 14a-8 under the Securities and Exchange Act of 1934) must deliver a notice of the proposal, in the form required by Section 6 of our Code of Regulations, to our corporate secretary on or before March 1, 2017,7, 2018, but not before January 21, 2017,26, 2018, or the shareholder’s proposal will not be permitted to be brought before the 20172018 Annual Meeting of Shareholders.Internetinternet and telephone voting service for our direct shareholders of record. We ask banks, brokerage houses, other custodians, nominees and fiduciaries to forward copies of the proxy materials to beneficial owners of shares or to request authority for the execution of proxies; and we have agreed to reimburse reasonable out-of-pocket expenses incurred. We have retained the services of Alliance Advisors LLC, a proxy solicitation firm, to assist us in soliciting proxies for the 20162017 Annual Meeting of Shareholders. The cost of such services is estimated at $12,500 plus out-of-pocket expenses.16, 2016Page 66nonstatutorynon-statutory financial measures to evaluate its primary business areas –- property casualty insurance, life insurance and investments. Management uses these measures when analyzing both GAAP and non-GAAP measures to improve its understanding of trends in the underlying business and to help avoid incorrect or misleading assumptions and conclusions about the success or failure of company strategies. Management adjustments to GAAP measures generally: apply to nonrecurringnon-recurring events that are unrelated to business performance and distort short-term results; involve values that fluctuate based on events outside of management’s control; supplement reporting segment disclosures with disclosures for a subsidiary company or for a combination of subsidiaries or reporting segments; or relate to accounting refinements that affect comparability between periods, creating a need to analyze data on the same basis.·Operating income: Operating income is calculated by excluding net realized investment gains and losses (defined as realized investment gains and losses after applicable federal and state income taxes) from net income. Management evaluates operating income to measure the success of pricing, rate and underwriting strategies. While realized investment gains (or losses) are integral to the company’s insurance operations over the long term, the determination to realize investment gains or losses in any period may be subject to management’s discretion and is independent of the insurance underwriting process. Also, under applicable GAAP accounting requirements, gains and losses can be recognized from certain changes in market values of securities without actual realization. Management believes that the level of realized investment gains or losses for any particular period, while it may be material, may not fully indicate the performance of ongoing underlying business operations in that period.·Value creation ratio: This is a measure of shareholder value creation that management believes captures the contribution of the company’s insurance operations, the success of its investment strategy and the importance placed on paying cash dividends to shareholders. The value creation ratio measure is made up of two primary components: (1) rate of growth in book value per share plus (2) the ratio of dividends declared per share to beginning book value per share. Management believes this non-GAAP measure is a useful supplement to GAAP information, providing a meaningful measure of long-term progress in creating shareholder value. It is intended to be all-inclusive regarding changes in book value per share, and uses originally reported book value per share in cases where book value per share has been adjusted, such as adoption of Accounting Standards Updates with a cumulative effect of a change in accounting.·Statutory accounting rules: For public reporting, insurance companies prepare financial statements in accordance with GAAP. However, insurers also must calculate certain data according to statutory accounting rules as defined in the NAIC’s Accounting Practices and Procedures Manual, which may be, and has been, modified by various state insurance departments. Statutory data is publicly available, and various organizations use it to calculate aggregate industry data, study industry trends and compare insurance companies.·Written premium: Under statutory accounting rules, property casualty written premium is the amount recorded for policies issued and recognized on an annualized basis at the effective datePage 67of the policy. Management analyzes trends in written premium to assess business efforts. Earned premium, used in both statutory and GAAP accounting, is calculated ratably over the policy term. The difference between written and earned premium is unearned premium.(Dollars are per share) Twelve months ended December 31, 2015 2014 Value creation ratio: End of period book value $ 39.20 $ 40.14 Less beginning of period book value 40.14 37.21 Change in book value (0.94 ) 2.93 Dividend declared to shareholders 2.30 1.76 Total value creation $ 1.36 $ 4.69 Value creation ratio from change in book value* (2.3 )% 7.9 % Value creation ratio from dividends declared to shareholders** 5.7 4.7 Value creation ratio 3.4 % 12.6 % *Change in book value divided by the beginning of period book value**Dividend declared to shareholders divided by beginning of period book value(Dollars are per share) Twelve months ended December 31, 2016 2015 Value creation ratio: End of period book value $ 42.95 $ 39.20 Less beginning of period book value 39.20 40.14 Change in book value 3.75 (0.94 ) Dividend declared to shareholders 1.92 2.30 Total value creation $ 5.67 $ 1.36 Value creation ratio from change in book value* 9.6 % (2.3 )% 4.9 5.7 Value creation ratio 14.5 % 3.4 % * Change in book value divided by the beginning of period book value ** Dividend declared to shareholders divided by beginning of period book value (Dollars in millions except per share data) Twelve months ended December 31, 2015 2014 Net income $ 634 $ 525 Realized investment gains and losses, net 45 85 Operating income 589 440 Less catastrophe losses (105 ) (133 ) Operating income before catastrophe losses $ 694 $ 573 Diluted per share data: Net income $ 3.83 $ 3.18 Realized investment gains and losses, net 0.27 0.52 Operating income 3.56 2.66 Less catastrophe losses (0.63 ) (0.81 ) Operating income before catastrophe losses $ 4.19 $ 3.47 Page 68Cincinnati Financial Corporation(Dollars in millions except per share data) Twelve months ended December 31, 2016 2015 Net income $ 591 $ 634 Less: Realized investment gains and losses, net 124 70 Income tax on realized investment gains and losses (44 ) (25 ) Realized investment gains and losses, after-tax 80 45 Operating income $ 511 $ 589 Diluted per share data: Net income $ 3.55 $ 3.83 Less: Realized investment gains and losses, net 0.74 0.42 Income tax on realized investment gains and losses (0.26 ) (0.15 ) Realized investment gains and losses, after-tax 0.48 0.27 Operating income $ 3.07 $ 3.56 (Dollars in millions) Twelve months ended December 31, 2016 2015 Net income of life insurance subsidiary $ 48 $ 41 Realized investment gains, net 8 1 Income tax on realized investment gains 3 1 Operating income 43 41 Investment income, net of expenses (155 ) (150 ) Investment income credited to contract holders' 90 86 Income tax on investment income and investment income credited to contract holders' 23 21 Life insurance segment profit (loss) $ 1 $ (2 ) (Dollars in millions) Twelve months ended December 31, 2015 Consolidated* Commercial Personal E&S Premiums: Written premiums $ 4,361 $ 3,025 $ 1,128 $ 175 Unearned premiums change (90 ) (29 ) (31 ) (7 ) Earned premiums $ 4,271 $ 2,996 $ 1,097 $ 168 Statutory ratios: Combined ratio 90.6 % 88.3 % 100.0 % 71.9 % Contribution from catastrophe losses 3.7 3.1 6.2 0.4 Combined ratio excluding catastrophe losses 86.9 % 85.2 % 93.8 % 71.5 % Commission expense ratio 18.5 % 18.3 % 17.7 % 27.2 % Other underwriting expense ratio 11.9 13.0 10.4 2.8 Total expense ratio 30.4 % 31.3 % 28.1 % 30.0 % GAAP ratios: Combined ratio 91.1 % 88.6 % 101.3 % 70.0 % Contribution from catastrophe losses 3.7 3.1 6.2 0.4 Prior accident years before catastrophe losses (3.9 ) (4.7 ) 0.8 (20.6 ) Current accident year combined ratio before catastrophe losses 91.3 % 90.2 % 94.3 % 90.2 % Dollar amounts shown are rounded to millions; certain amounts may not add due to rounding. Ratios are calculated based on dollar amounts in thousands.*Consolidated property casualty data includes results from our Cincinnati ReSM operations. (Dollars in millions) Twelve months ended December 31, 2016 Consolidated Commercial Personal E&S Cincinnati Re Premiums: Written premiums $ 4,580 $ 3,122 $ 1,198 $ 189 $ 71 Unearned premiums change (98 ) (33 ) (37 ) (6 ) (22 ) Earned premiums $ 4,482 $ 3,089 $ 1,161 $ 183 $ 49 Statutory ratios: Combined ratio 94.5 % 93.9 % 100.8 % 68.1 % 79.6 % Contribution from catastrophe losses 7.5 7.1 9.4 1.5 6.8 Combined ratio excluding catastrophe losses 87.0 % 86.8 % 91.4 % 66.6 % 72.8 % Commission expense ratio 18.4 % 18.1 % 17.7 % 27.1 % 21.1 % Other underwriting expense ratio 12.3 13.4 10.7 3.4 8.1 Total expense ratio 30.7 % 31.5 % 28.4 % 30.5 % 29.2 % GAAP ratios: Combined ratio 94.8 % 94.2 % 101.4 % 67.0 % 82.5 % Contribution from catastrophe losses 7.5 7.1 9.4 1.5 6.8 Prior accident years before catastrophe losses (3.5 ) (4.0 ) 0.0 (18.3 ) (3.2 ) 90.8 % 91.1 % 92.0 % 83.8 % 78.9 % Dollar amounts shown are rounded to millions; certain amounts may not add due to rounding. Ratios are calculated based on dollar amounts in thousands. 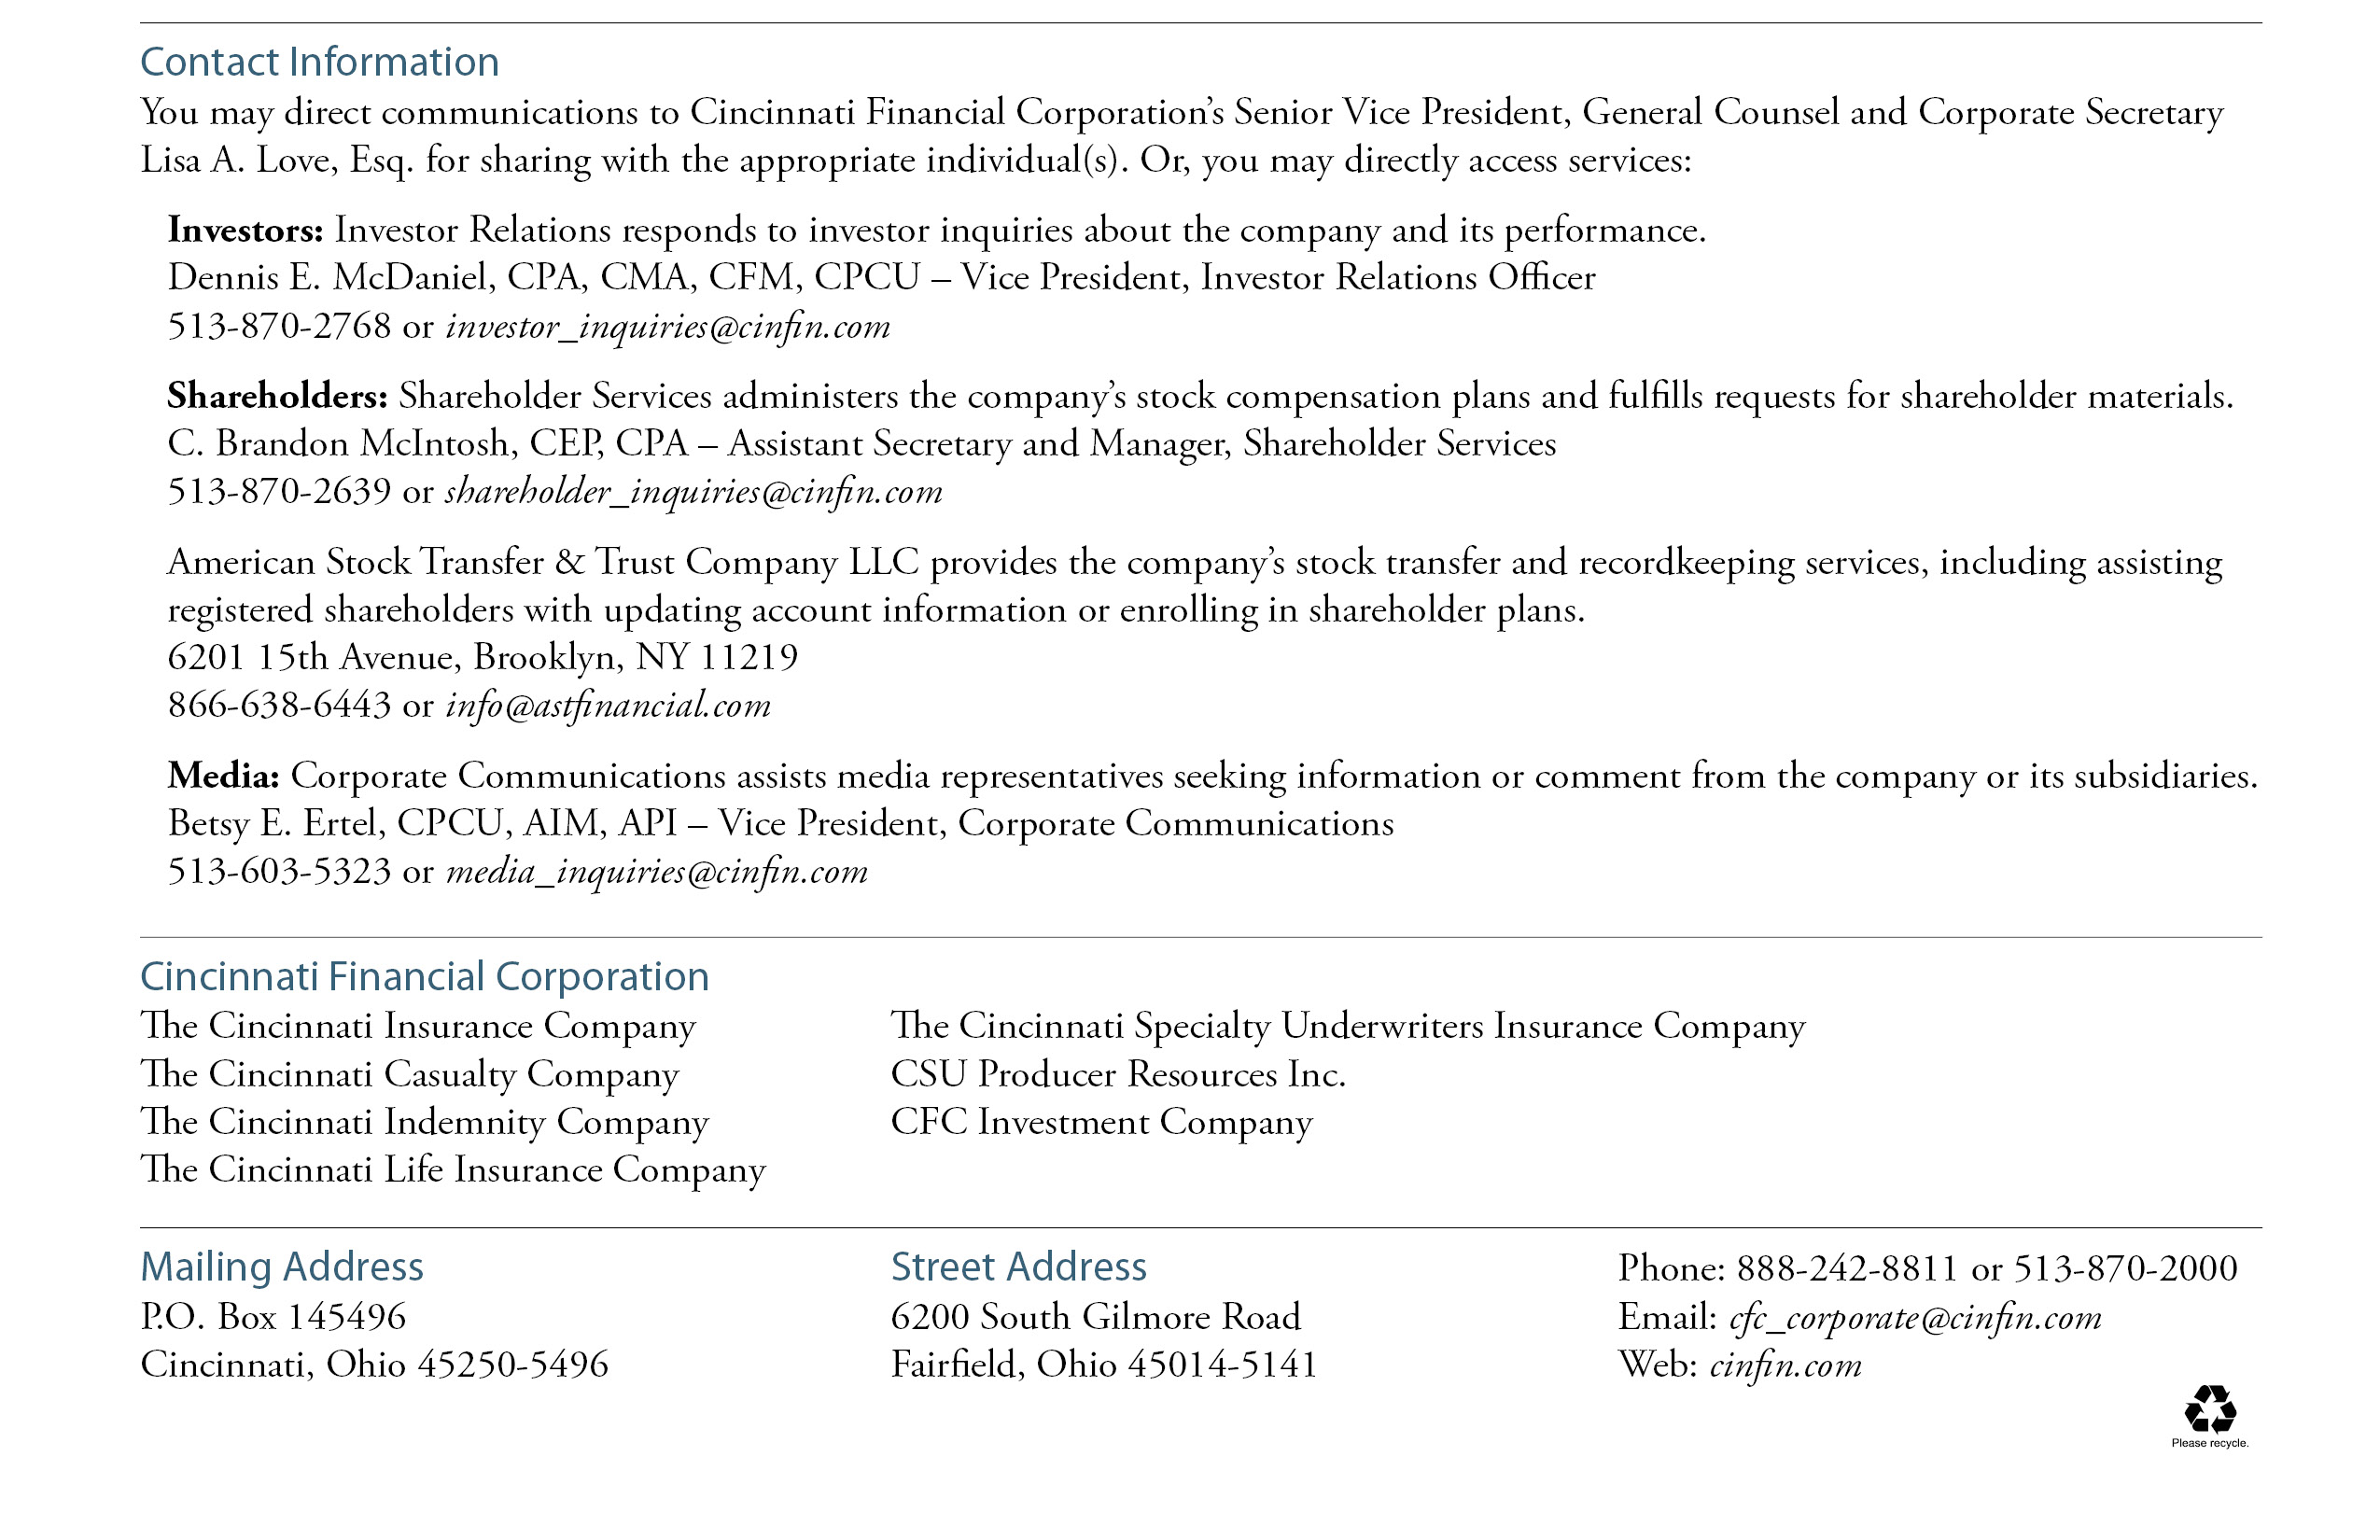
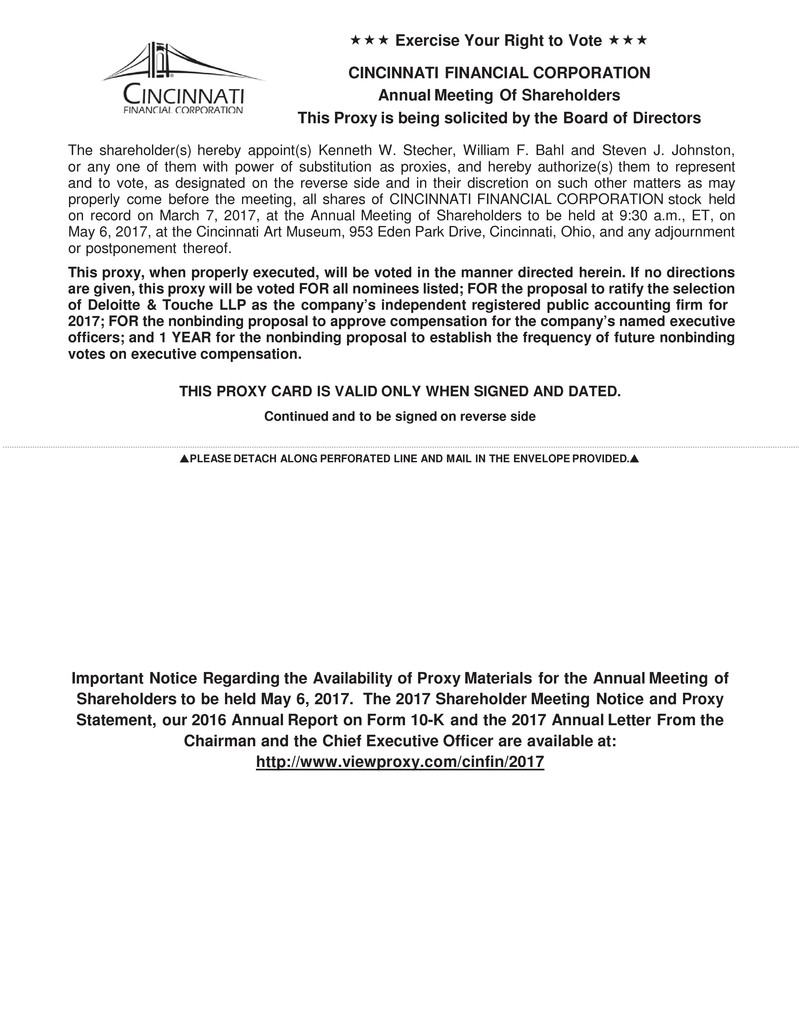
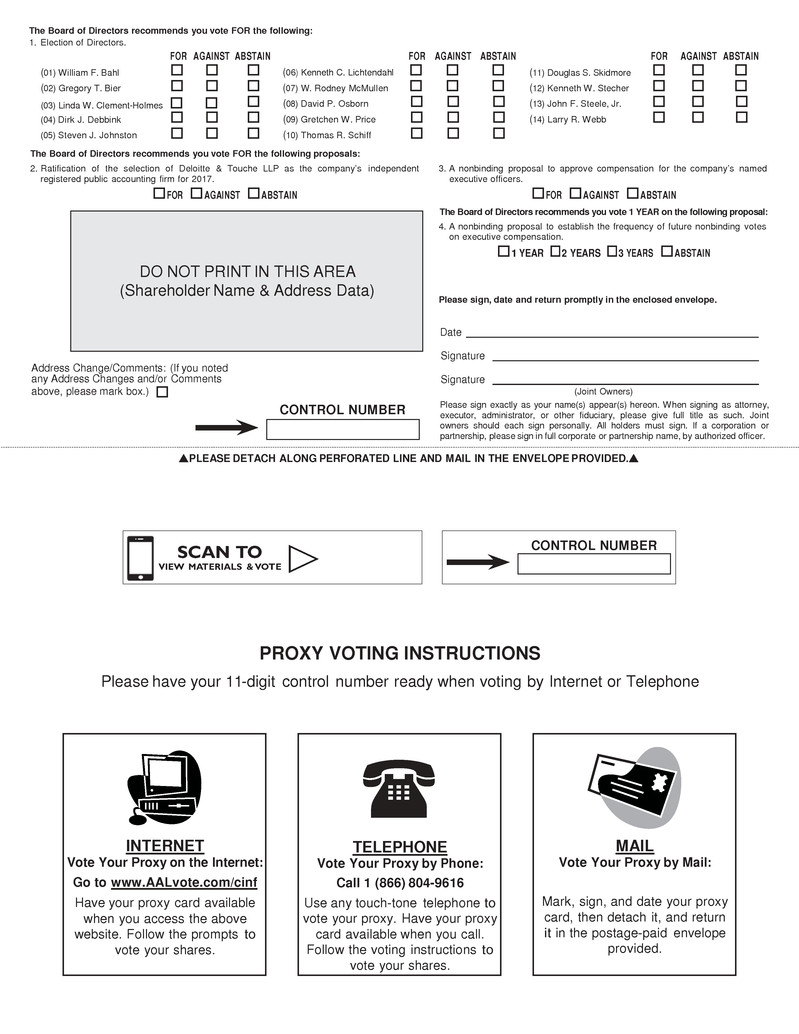
6982Cincinnati Financial Corporation 2016 Stock Compensation Plan1.Purpose.The purpose of the Plan is to support the Company’s ongoing efforts to attract, develop, retain and motivate Associates and to provide them with incentives that are directly linked to the profitability of the Company’s businesses and to increases in shareholder value.2.Definitions. For purposes of the Plan, the following terms are defined as set forth below:a.“Associate” means employee of the Company or its operating subsidiaries and affiliates.b.“Award” means a grant under the Plan of Stock Options, Stock Appreciation Rights, Restricted Stock, Restricted Stock Units, or Other Stock-Based Awards.c.“Board” means the Board of Directors of the Company.d.“Code” means the Internal Revenue Code of 1986, as amended from time to time, and any successor thereto.e.“Commission” means the Securities and Exchange Commission or any successor agency.f.“Committee” means the compensation committee of the Board or a subcommittee thereof, any successor thereto or such other committee or subcommittee as may be designated by the Board to administer the Plan, which, in any case, shall include as members at least two “nonemployees” within the meaning of Rule 16b-3 of the SEC, two “outside directors” for purposes of Code Section 162(m), and which is otherwise in compliance with any other requirements of applicable laws or regulations or the requirements of The Nasdaq Global Select Market.g.“Common Stock” or “Stock” means the common stock of the Company.h.“Company” means Cincinnati Financial Corporation, a corporation organized under the laws of the State of Ohio, or any successor thereto.i.“Exchange Act” means the Securities Exchange Act of 1934, as amended from time to time, and any successor thereto.j.“Fair Market Value” means, as of any given date, the mean between the highest and lowest reported sales prices of the Common Stock on The Nasdaq Global Select Market, or, if no such sale of Common Stock is reported on such date, the fair market value of the Stock as determined by the Committee in good faith.k.“Incentive Stock Option” means any Stock Option that complies with Section 422 (or any amended or successor provision) of the Code.l.“Nonqualified Stock Option” means any Stock Option that is not an Incentive Stock Option.m.“Other Stock-Based Award” means an Award made pursuant to Section 6(a)(v).n.“Participant” means any eligible Associate as set forth in Section 4 to whom an Award is granted.o.“Performance Cycle” means the period selected by the Committee during which the performance of the Company or of any subsidiary, affiliate or of unit thereof or any individual is measured for the purpose of determining the extent to which an Award subject to Performance Goals has been earned.p.“Performance Goals” mean the objectives for the Company or any subsidiary or affiliate or any unit thereof or any individual that may be established by the Committee for a Performance Cycle with respect to any performance-based Awards contingently awarded under the Plan. The Performance Goals for Awards that are intended to constitute “performance-based” compensation within the meaning of Section 162(m) (or any amended or successor provision) of the Code shall be derived from one or more of the following criteria: earnings per share, total shareholder return, operating income, net income, adjusted net earnings, cash flow, return on equity, return on capital, the combined ratio, premium growth, investment performance, and/or value creation ratio.q.“Plan” means this Cincinnati Financial Corporation 2016 Stock Compensation Plan, as amended from time to time.Page 70r.“Restricted Period” means the period during which an Award may not be sold, assigned, transferred, pledged or otherwise encumbered.s.“Restricted Stock” means an Award of shares of Common Stock pursuant to Section 6(a)(iii).t.“Restricted Stock Unit” means an Award described in Section 6(a)(iv).u.“Spread Value” means, with respect to a share of Common Stock subject to an Award, an amount equal to the excess of the Fair Market Value, on the date such value is determined, over the Award’s exercise or grant price, if any.v.“Stock Appreciation Right” or “SAR” means a right granted pursuant to Section 6(a)(ii).w.“Stock Option” means an Incentive Stock Option or a Nonqualified Stock Option granted pursuant to Section 6(a)(i).x.“Value Creation Ratio” means the total of 1) rate of growth in book value per share plus 2) the ratio of dividends declared per share to beginning book value per share.3.Administration. The Plan shall be administered by the Committee, which shall have the power to interpret the Plan and to adopt such rules and guidelines for carrying out the Plan as it may deem appropriate. The Committee shall have the authority to adopt such modifications, procedures and sub-plans as may be necessary or desirable to comply with all applicable laws, regulations, and accounting principles. Subject to the terms of the Plan, the Committee shall have the authority to determine those Associates who shall receive Awards and the amount, type and terms of each Award, and to establish and administer any Performance Goals applicable to such Awards. The Committee may delegate its authority and power under the Plan to one or more officers of the Company, subject to guidelines prescribed by the Committee, but only with respect to Participants who are not subject to either Section 16 of the Exchange Act or Section 162(m) (or any amended or successor provision) of the Code. Any determination made by the Committee or by one or more officers pursuant to delegated authority in accordance with the provisions of the Plan with respect to any Award shall be made in the sole discretion of the Committee or such delegate, and all decisions made by the Committee or any appropriately designated officer pursuant to the provisions of the Plan shall be final, binding and conclusive on all persons, including the Company and Plan Participants.4.Eligibility. All Associates of the Company and its subsidiaries and affiliates are eligible to be granted Awards under the Plan. No Associate shall have at any time the right to receive an Award, or having previously received an Award, to receive any further Awards.5.Common Stock Subject to the Plan.a.Common Stock Available. The total number of shares of Common Stock reserved and available for distribution pursuant to Awards granted under the Plan shall be 10,000,000; provided, however, that any shares of Common Stock issued to Participants pursuant to Awards in any form other than Stock Options shall be counted against such 10,000,000-share limit as three shares for every one share of Common Stock actually issued. Each Stock Appreciation Right Award granted under the Plan that may be settled in shares of Common Stock shall be counted in full (i.e., to the extent of the face number of shares originally granted) against the maximum number of shares of Common Stock available for award under the Plan, regardless of the actual number of shares of Common Stock that are actually issued to the Participant upon settlement of the Stock Appreciation Right. Shares issued under the Plan may be either authorized but unissued shares or treasury shares, as designated by the Committee. To the extent any Award under this Plan terminates, expires or is forfeited without a distribution being made to the Participant in the form of Common Stock, the shares subject to such Award that were not so issued, if any, shall again become available for distribution in connection with Awards under the Plan. Any shares of Common Stock that are used by a Participant as full or partial payment of withholding or other taxes or as payment for the exercise or conversion price of an Award under the Plan shall not be available for subsequent distribution in connection with Awards under the Plan.b.Adjustments for Certain Corporate Transactions.In the event of any merger, share exchange, reorganization, consolidation, recapitalization, reclassification, distribution, stockPage 71dividend, stock split, reverse stock split, split-up, spin-off, issuance of rights or warrants or other similar transaction or event affecting the Common Stock after adoption of the Plan, the Committee is authorized to make such adjustments or substitutions with respect to the Plan and to Awards granted hereunder as it deems appropriate to reflect the occurrence of such event, including, but not limited to, adjustments (A) to the aggregate number and kind of securities reserved for issuance under the Plan, (B) to the Award limits set forth in Section 6, (C) to the Performance Goals or Performance Cycles of any outstanding Performance-Based Awards, and (D) to the number and kind of securities subject to outstanding Awards and, if applicable, the grant or exercise price or Spread Value of outstanding Awards. In connection with any of the events described in this Section 5(b), the Committee is also authorized to provide for the payment of any outstanding Awards in cash, including, but not limited to, payment of cash in lieu of any fractional Awards. In the event of any conflict between this Section 5(b) and other provisions of the Plan, the provisions of this section shall control.6.Awards.a.General. The types of Awards that may be granted under the Plan are set forth below. Awards may be granted singly, in combination or in tandem with other Awards.i.Stock Options.A Stock Option represents the right to purchase a share of stock at a predetermined grant price. Stock Options granted under the Plan may be in the form of Incentive Stock Options or Nonqualified Stock Options, as specified in the Award agreement. The term of each Stock Option shall be set forth in the Award agreement, but no Stock Option shall be exercisable more than 10 years after the grant date. The grant price per share of Common Stock purchasable under a Stock Option shall not be less than 100 percent of the Fair Market Value on the date of grant. Subject to the applicable Award agreement, Stock Options may be exercised, in whole or in part, by giving written notice of exercise specifying the number of shares to be purchased. Such notice shall be accompanied by payment in full of the purchase price by certified or bank check or such other instrument as the Company may accept (including a copy of instructions to a broker or bank acceptable to the Company to deliver promptly to the Company an amount sufficient to pay the purchase price). Unless otherwise determined by the Committee, payment in full or in part may also be made in the form of Common Stock already owned by the Participant valued at Fair Market Value. Except for a beneficiary designation as permitted by the terms of the applicable Award agreement or as designated by a Participant by will or as prescribed by the laws of descent and distribution, Stock Options may not be sold, assigned, transferred, pledged or otherwise encumbered.ii.Stock Appreciation Rights. A SAR represents the right to receive a payment, in cash, shares of Common Stock, or both (as determined by the Committee), with a value equal to the Spread Value on the date the SAR is exercised. The grant price of a SAR shall be set forth in the applicable Award agreement and shall not be less than 100 percent of the Fair Market Value on the date of grant. Subject to the terms of the applicable Award agreement, a SAR shall be exercisable, in whole or in part, by giving written notice of exercise to the Company in the manner prescribed in the applicable Award agreement. Except for a beneficiary designation as permitted by the terms of the applicable Award agreement or as designated by a Participant by will or prescribed by the laws of descent and distribution, SARs may not be sold, assigned, transferred, pledged or otherwise encumbered.iii.Restricted Stock. Shares of Restricted Stock are shares of Common Stock that are awarded to a Participant and that during the Restricted Period may be forfeitable to the Company upon such conditions as may be set forth in the applicable Award agreement. Except for a beneficiary designation as permitted by the terms of the applicable Award agreement or as designated by a Participant by will or prescribed by the laws of descent and distribution, Restricted Stock may not be sold, assigned, transferred, pledged or otherwise encumbered during the Restricted Period. Except as provided above or in the applicable Award agreement, a Participant shall have with respect to such Restricted Stock all the rights of a holder of Common Stock during the Restricted Period.Page 72iv.Restricted Stock Units. Restricted Stock Units represent the right to receive shares of Common Stock, cash, or both (as determined by the Committee) upon satisfaction of such conditions as may be set forth in the applicable Award agreement. Except for a beneficiary designation as permitted by the terms of the applicable Award agreement or as designated by a Participant by will or prescribed by the laws of descent and distribution, Restricted Stock Units may not be sold, assigned, transferred, pledged or otherwise encumbered during the Restricted Period. Except as provided in the applicable Award agreement, a Participant shall have with respect to such Restricted Stock Units none of the rights of a holder of Common Stock unless and until shares of Common Stock are actually delivered in satisfaction of the conditions underlying such Restricted Stock Units.v.Other Stock-Based Awards.Other Stock-Based Awards are Awards, other than Stock Options, SARs, Restricted Stock, or Restricted Stock Units that are denominated in, valued in whole or in part by reference to, or otherwise based on or related to, Common Stock. The grant, purchase, exercise, exchange or conversion of Other Stock-Based Awards granted under this subsection (v) shall be on such terms and conditions and by such methods as shall be specified by the Committee. Where the value of an Other Stock-Based Award is based on the Spread Value, the grant price for such an Award shall not be less than 100 percent of the Fair Market Value on the date of grant.b.Performance-Based Awards. Any Awards granted pursuant to the Plan may be in the form of performance-based Awards through the application of Performance Goals and Performance Cycles.c.Award Limitations.Awards granted under the Plan which are intended to qualify as performance-based compensation under Section 162(m) of the Code shall be subject to the following limitations:i.Stock Options. No Participant shall be granted Stock Options on more than 100,000 shares of Common Stock during any single calendar year.ii.Incentive Stock Options.The aggregate Fair Market Value (at the grant date) of the Common Stock with respect to which Incentive Stock Options are first exercisable by any Participant in any one calendar year shall not exceed $100,000.iii.Restricted Stock and Restricted Stock Units.No Participant shall be granted Restricted Stock and/or Restricted Stock Units in a total amount exceeding 100,000 shares of Common Stock during any single calendar year.iv.Stock Appreciation Rights and Other Stock-Based Awards. No Participant shall be granted Stock Appreciation Rights and/or Other Stock-Based Awards in a total amount exceeding 100,000 shares of Common Stock during any single calendar year.7.Change in Control.Unless otherwise expressly provided in an applicable Award agreement and notwithstanding any other provision of the Plan to the contrary, if a Participant’s employment with the Company is terminated by action of the employing entity within 12 months after the effective date of a Change in Control, then all Stock Options and Stock Appreciation Rights held by such Participant as of the date of termination shall become fully vested and exercisable, and the restrictions and other conditions applicable to any Restricted Stock, Restricted Stock Units, or Other Stock-Based Awards held by such Participant as of the date of termination, including vesting requirements, shall lapse, and such Awards shall become free of all restrictions and fully vested. For this purpose, a “Change in Control” means the event which shall be deemed to have occurred after the date this Plan is adopted by the Company’s shareholders if either (i), any person, entity or group becomes a beneficial owner, directly or indirectly, of securities of the Company representing 20 percent or more of the combined voting power of the Company’s then outstanding securities; or (ii) as a result of, or in connection with, or within two years following, a tender or exchange offer for the voting stock of the Company, a merger or other business combination to which the Company is a party, the sale or other disposition of all or substantially all of the assets of the Company, a reorganization of the Company, or a proxy contest inPage 73connection with the election of members of the Board of Directors, the persons who were directors of the Company immediately prior to any such transactions cease to constitute a majority of the Board of Directors or of the board of directors of any successor to the Company (except for resignation due to death, disability or normal retirement). For purposes of the definition in the preceding sentence, any terms that are defined by rules promulgated by the SEC shall have the meanings specified in such definitions from time to time.8.Clawback and Forfeiture.Any awards granted under the Plan may be subject to reduction, cancellation, forfeiture or recoupment to the extent required by applicable laws, regulations, stock exchange rules, Company policies or to the extent otherwise provided in an Award agreement at the time of grant.9.Plan Amendment and Termination. The Board may amend or terminate the Plan at any time, provided that no amendment shall be made without shareholder approval if such approval is required under applicable law, regulation, or stock exchange rule, or if such amendment would (i) decrease the grant or exercise price of any Stock Option, SAR or Other Stock-Based Award to less than the Fair Market Value on the date of grant, or (ii) increase the total number of shares of Common Stock that may be distributed under the Plan. The Committee may not, without shareholder approval, cancel any Stock Option, SAR or Other Stock-Based Award and substitute it with a lower grant price, cash or other awards. Except as set forth in any Award agreement or as necessary to comply with applicable law or avoid adverse tax consequences to some or all Plan Participants, no amendment or termination of the Plan may materially and adversely affect any outstanding Award under the Plan without the Award recipient’s consent.10.Payments and Payment Deferrals.Payment of Awards may be in the form of cash, Common Stock, other Awards or combinations thereof as the Committee shall determine, and with such restrictions as it may impose. The Committee, either at the time of grant or by subsequent amendment, may require or permit deferral of the payment of Awards under such rules and procedures as it may establish. It also may provide that deferred settlements include the payment or crediting of interest or other earnings on the deferred amounts, or the payment or crediting of dividend equivalents where the deferred amounts are denominated in Common Stock equivalents.11.Award Agreements.Each Award under the Plan shall be evidenced by a written agreement in a form prescribed by the Committee that sets forth the terms, conditions and limitations for each Award. Such terms may include, but are not limited to, the term of the Award, vesting and forfeiture provisions, and the provisions applicable in the event the Participant’s employment terminates. The Committee may amend an Award agreement, provided that, except as set forth in any Award agreement or as necessary to comply with applicable law or avoid adverse tax consequences to some or all Plan Participants, no such amendment may materially and adversely affect an Award without the Participant’s consent.12.Unfunded Status of Plan.It is presently intended that the Plan constitute an “unfunded” plan for incentive and deferred compensation. The Committee may authorize the creation of trusts or other arrangements to meet the obligations created under the Plan to deliver Common Stock or make payments; provided, however, that, unless the Committee otherwise determines, the existence of such trusts or other arrangements is consistent with the “unfunded” status of the Plan.13.General Provisions.a.Investment Representations.The Committee may require each person acquiring shares of Common Stock pursuant to an Award to represent to and agree with the Company in writing that such person is acquiring the shares for investment and not with a view to the distribution thereof. The certificates for such shares may include any legend that the Committee deems appropriate to reflect any restrictions on transfer.Page 74b.Not an Employment Obligation.Neither the adoption of the Plan nor the granting of Awards under the Plan shall confer upon any Associate any right to continued employment nor shall they interfere in any way with the right of the Company, a subsidiary or an affiliate to terminate the employment of any Associate at any time.c.Income Tax Withholding.No later than the date as of which an amount first becomes includable in the gross income of the Participant for income tax purposes with respect to any Award under the Plan, the Participant shall pay to the Company, or make arrangements satisfactory to the Company for the payment of, any federal, state, local or foreign taxes of any kind that are required by law or applicable regulation to be withheld with respect to such amount. Unless otherwise determined by the Committee and except in the case of Incentive Stock Options, withholding obligations arising from an Award may be settled with Common Stock, including Common Stock that is part of, or is received upon exercise or conversion of, the Award that gives rise to the withholding requirement. The obligations of the Company under the Plan shall be conditional on such payment or arrangements, and the Company, its subsidiaries and its affiliates shall, to the extent permitted by law, have the right to deduct any such taxes from any payment otherwise due to the Participant. The Committee may establish such procedures as it deems appropriate, including the making of irrevocable elections, for the settling of withholding obligations with Common Stock.d.Governing Law.The Plan and all Awards made and actions taken thereunder shall be governed by and construed in accordance with the laws of the State of Ohio, excluding any conflicts or choice of law, rule or principle that might otherwise refer construction or interpretation of the Plan to the substantive law of another jurisdiction. Unless otherwise provided in an Award, recipients of an Award under the Plan are deemed to submit to the exclusive jurisdiction and venue of the federal or state courts of Ohio to resolve any and all issues that may arise out of or relate to the Plan or any related Award.e.Severability.If any provision of the Plan is held invalid or unenforceable, the invalidity or unenforceability shall not affect the remaining parts of the Plan, and the Plan shall be enforced and construed as if such provision had not been included.f.Successors and Assigns.All obligations of the Company under the Plan with respect to Awards granted hereunder shall be binding on any successor to the Company, whether the existence of such successor is the result of a direct or indirect purchase, merger, consolidation, or otherwise, of all or substantially all of the business and/or assets of the Company.g.Effective Date; Plan Expiration.If approved by the Company shareholders, the Plan shall become effective on April 30, 2016. Except as otherwise provided by the Board, no Awards shall be made after April 29, 2026, provided that any Awards granted prior to that date may extend beyond it, and provided further that the Performance Goals shall be subject to approval of the Company’s shareholders at least once every five years as prescribed by Code Section 162(m).Page 75
Contact InformationYou may direct communications to Cincinnati Financial Corporation’s Senior Vice President, General Counsel and Corporate Secretary Lisa A. Love, Esq. for sharing with the appropriate individual(s). Or, you may directly access services:Investors:Investor Relations responds to investor inquiries about the company and its performance. Dennis E. McDaniel, CPA, CMA, CFM, CPCU – Vice President, Investor Relations Officer 513-870-2768 orinvestor_inquiries@cinfin.comShareholders:Shareholder Services administers the company’s stock compensation plans and fulfills requests for shareholder materials.Molly A. Grimm, CEP – Assistant Vice President, Shareholder Services 513-870-2639 orshareholder_inquiries@cinfin.comAmerican Stock Transfer & Trust Company LLC provides the company’s stock transfer and recordkeeping services, including assisting registered shareholders with updating account information or enrolling in shareholder plans. 6201 15th Avenue, Brooklyn, NY 11219 866-638-6443 orinfo@amstock.comMedia:Corporate Communications assists media representatives seeking information or comment from the company or its subsidiaries. Betsy E. Ertel, CPCU, AIM, API – Vice President, Corporate Communications 513-603-5323 ormedia_inquiries@cinfin.comCINCINNATI FINANCIAL CORPORATIONThe Cincinnati Insurance Company The Cincinnati Casualty Company The Cincinnati Indemnity Company The Cincinnati Life Insurance Company The Cincinnati Specialty Underwriters Insurance Company CSU Producer Resources Inc. CFC Investment Company Mailing Address P.O. Box 145496 Cincinnati, Ohio 45250-5496 Street Address 6200 South Gilmore Road Fairfield, Ohio 45014-5141 Phone: 888-242-8811 or 513-870-2000 Email:cfc_corporate@cinfin.com Web:cinfin.comPage 76
